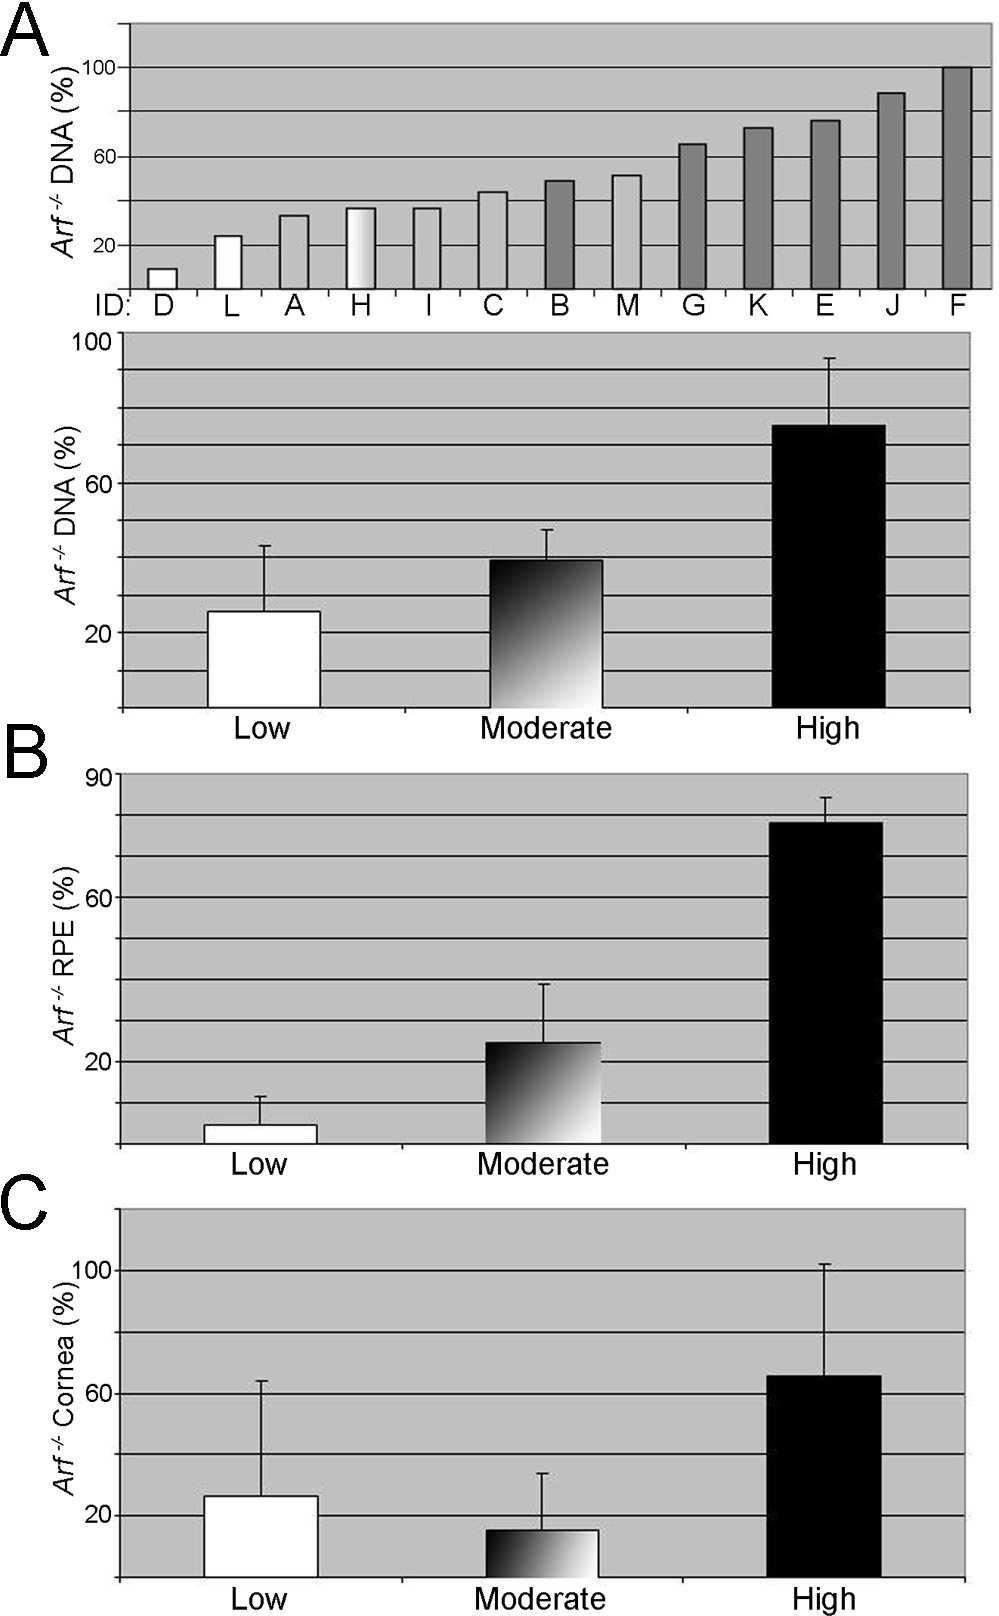
Figure 7. Ocular disease severity, based on fundoscopic findings, correlates with Arf −/− contribution to DNA and the retinal pigment epithelium (RPE). Relative amount of Arf −/− cells in individual eyes (top chart in A; letters denote individual animals consistent throughout the manuscript) and average Arf −/− contribution (bottom chart in A, and B and C) in eyes noted prospectively to have low, moderate, or high disease severity. Shaded bars (top chart in A) show individual eyes with low (white), moderate (gray), and high (dark gray) disease severity. Note that H has one eye each
with low and moderate eye disease. The non-parametric trend test is significant in A and B (p = 0.004 and p = 0.008, respectively) but not significant in C (p = 0.159).

 Figure 7 of
Mary-Sinclair, Mol Vis 2014; 20:215-230.
  Figure 7 of
Mary-Sinclair, Mol Vis 2014; 20:215-230.