Figure 3. The percentage of Arf −/− lineage in the tail-derived DNA and retinal pigment epithelium (RPE) correlate with each other, but not as well with the
corneal epithelium. A–C: Quantitative analysis of individual eyes depicts the percent Arf −/− genotype for the RPE, tail DNA, and the cornea. Black and white bars denote specific tissue as indicated on individual charts.
Letters and letter primes denote individual eyes from the same chimeric animal. D–F: Linear regressions show excellent correlation of genotype in the RPE compared to tail-derived DNA (Pearson correlation coefficient
= 0.97; p<0.001; D), and a weaker correlation when DNA (E) or RPE (F) is compared to the cornea (Pearson correlation coefficients = 0.63 [p = 0.014] and 0.64 [p = 0.010], respectively).
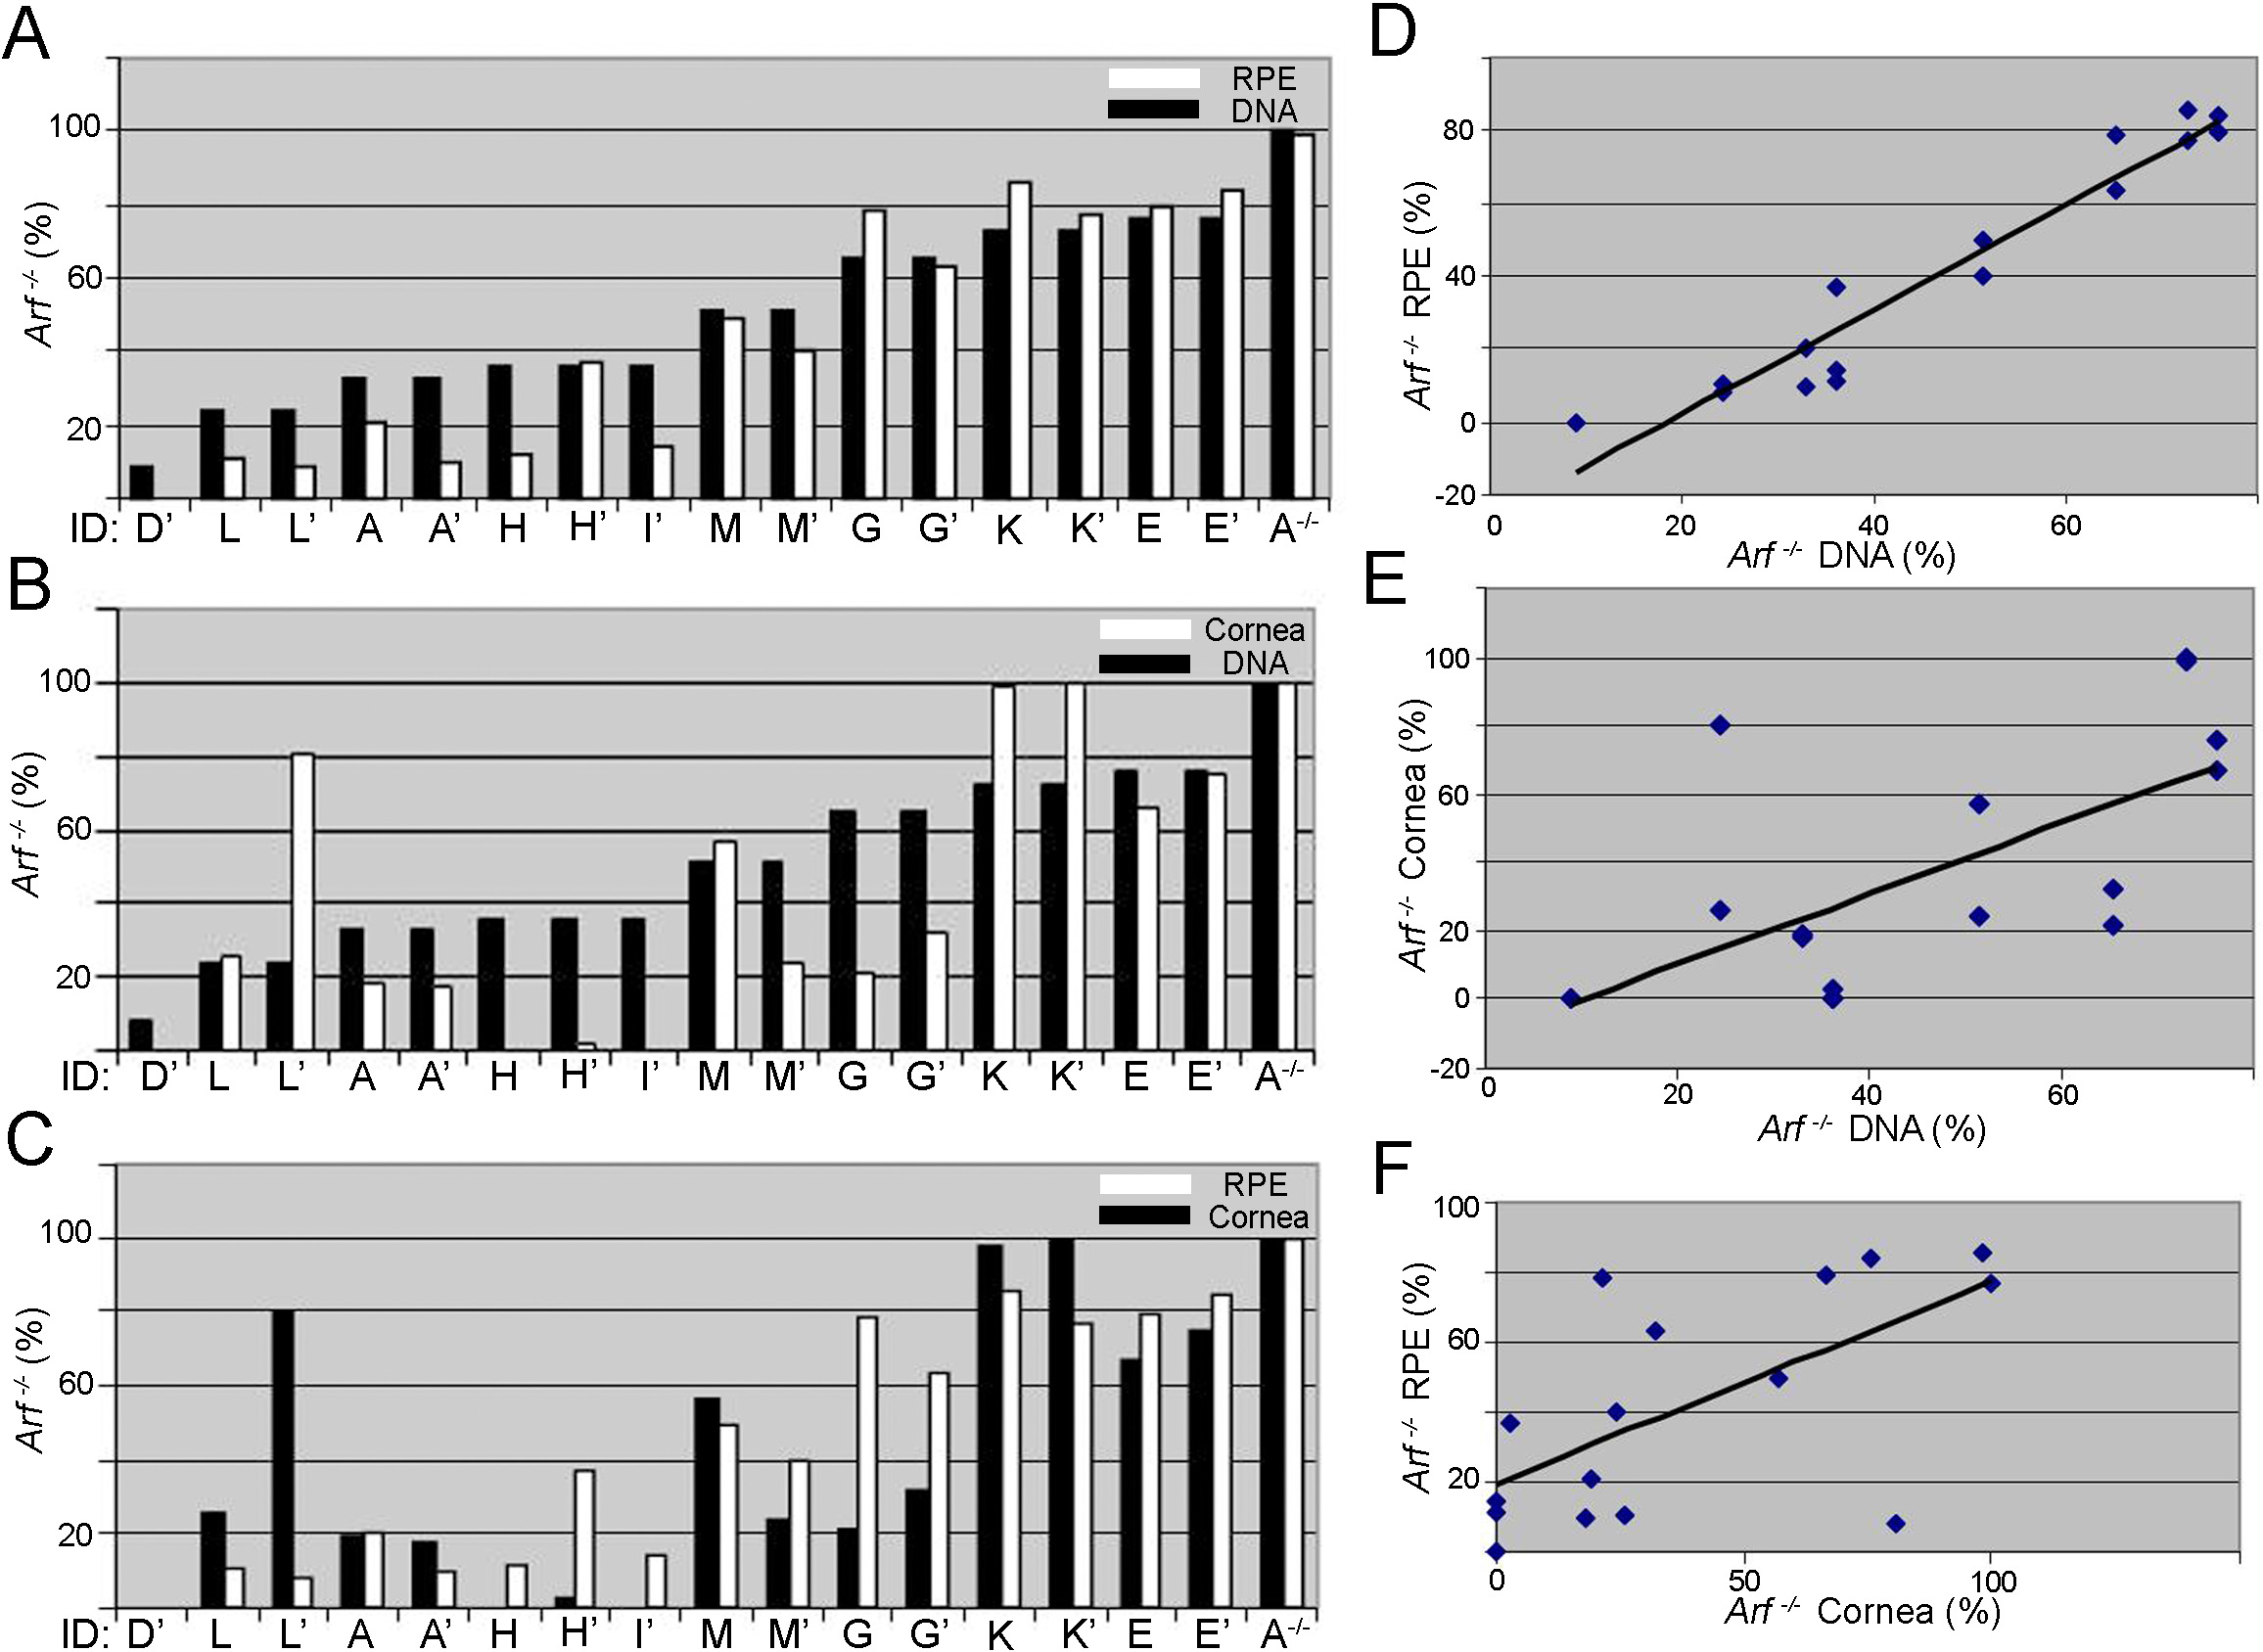
 Figure 3 of
Mary-Sinclair, Mol Vis 2014; 20:215-230.
Figure 3 of
Mary-Sinclair, Mol Vis 2014; 20:215-230.