Figure 7. Rhodopsin expression at the cell surface HEK-293 cells transfected with rhodopsin-green fluorescent protein and stained with
CD44 antibody, a marker of the cell surface. These images reflect the higher levels of surface rhodopsin in cells transfected
with plasmids that express rhodopsin variants with low, rather than high, stability changes (A: Wild-type=0 kcal/mol. B: G106R=1.94 kcal/mol. C: D190n=2.26 kcal/mol. D: P23Y=27.44 kcal/mol). There were clearly higher levels of surface expression associated with the mildly destabilizing G106R
mutation than with any of the other mutant variants. Unlike the wild-type and G106R mutant, the majority of the D190N rhodopsin
remained in the cytoplasm, but in those cells where it was detected at the cell surface, there was a relatively even distribution
(white arrows). This is in contrast to the other mutations, such as P23Y, which demonstrated low levels of surface rhodopsin
that was restricted to discrete foci on the plasma membrane.
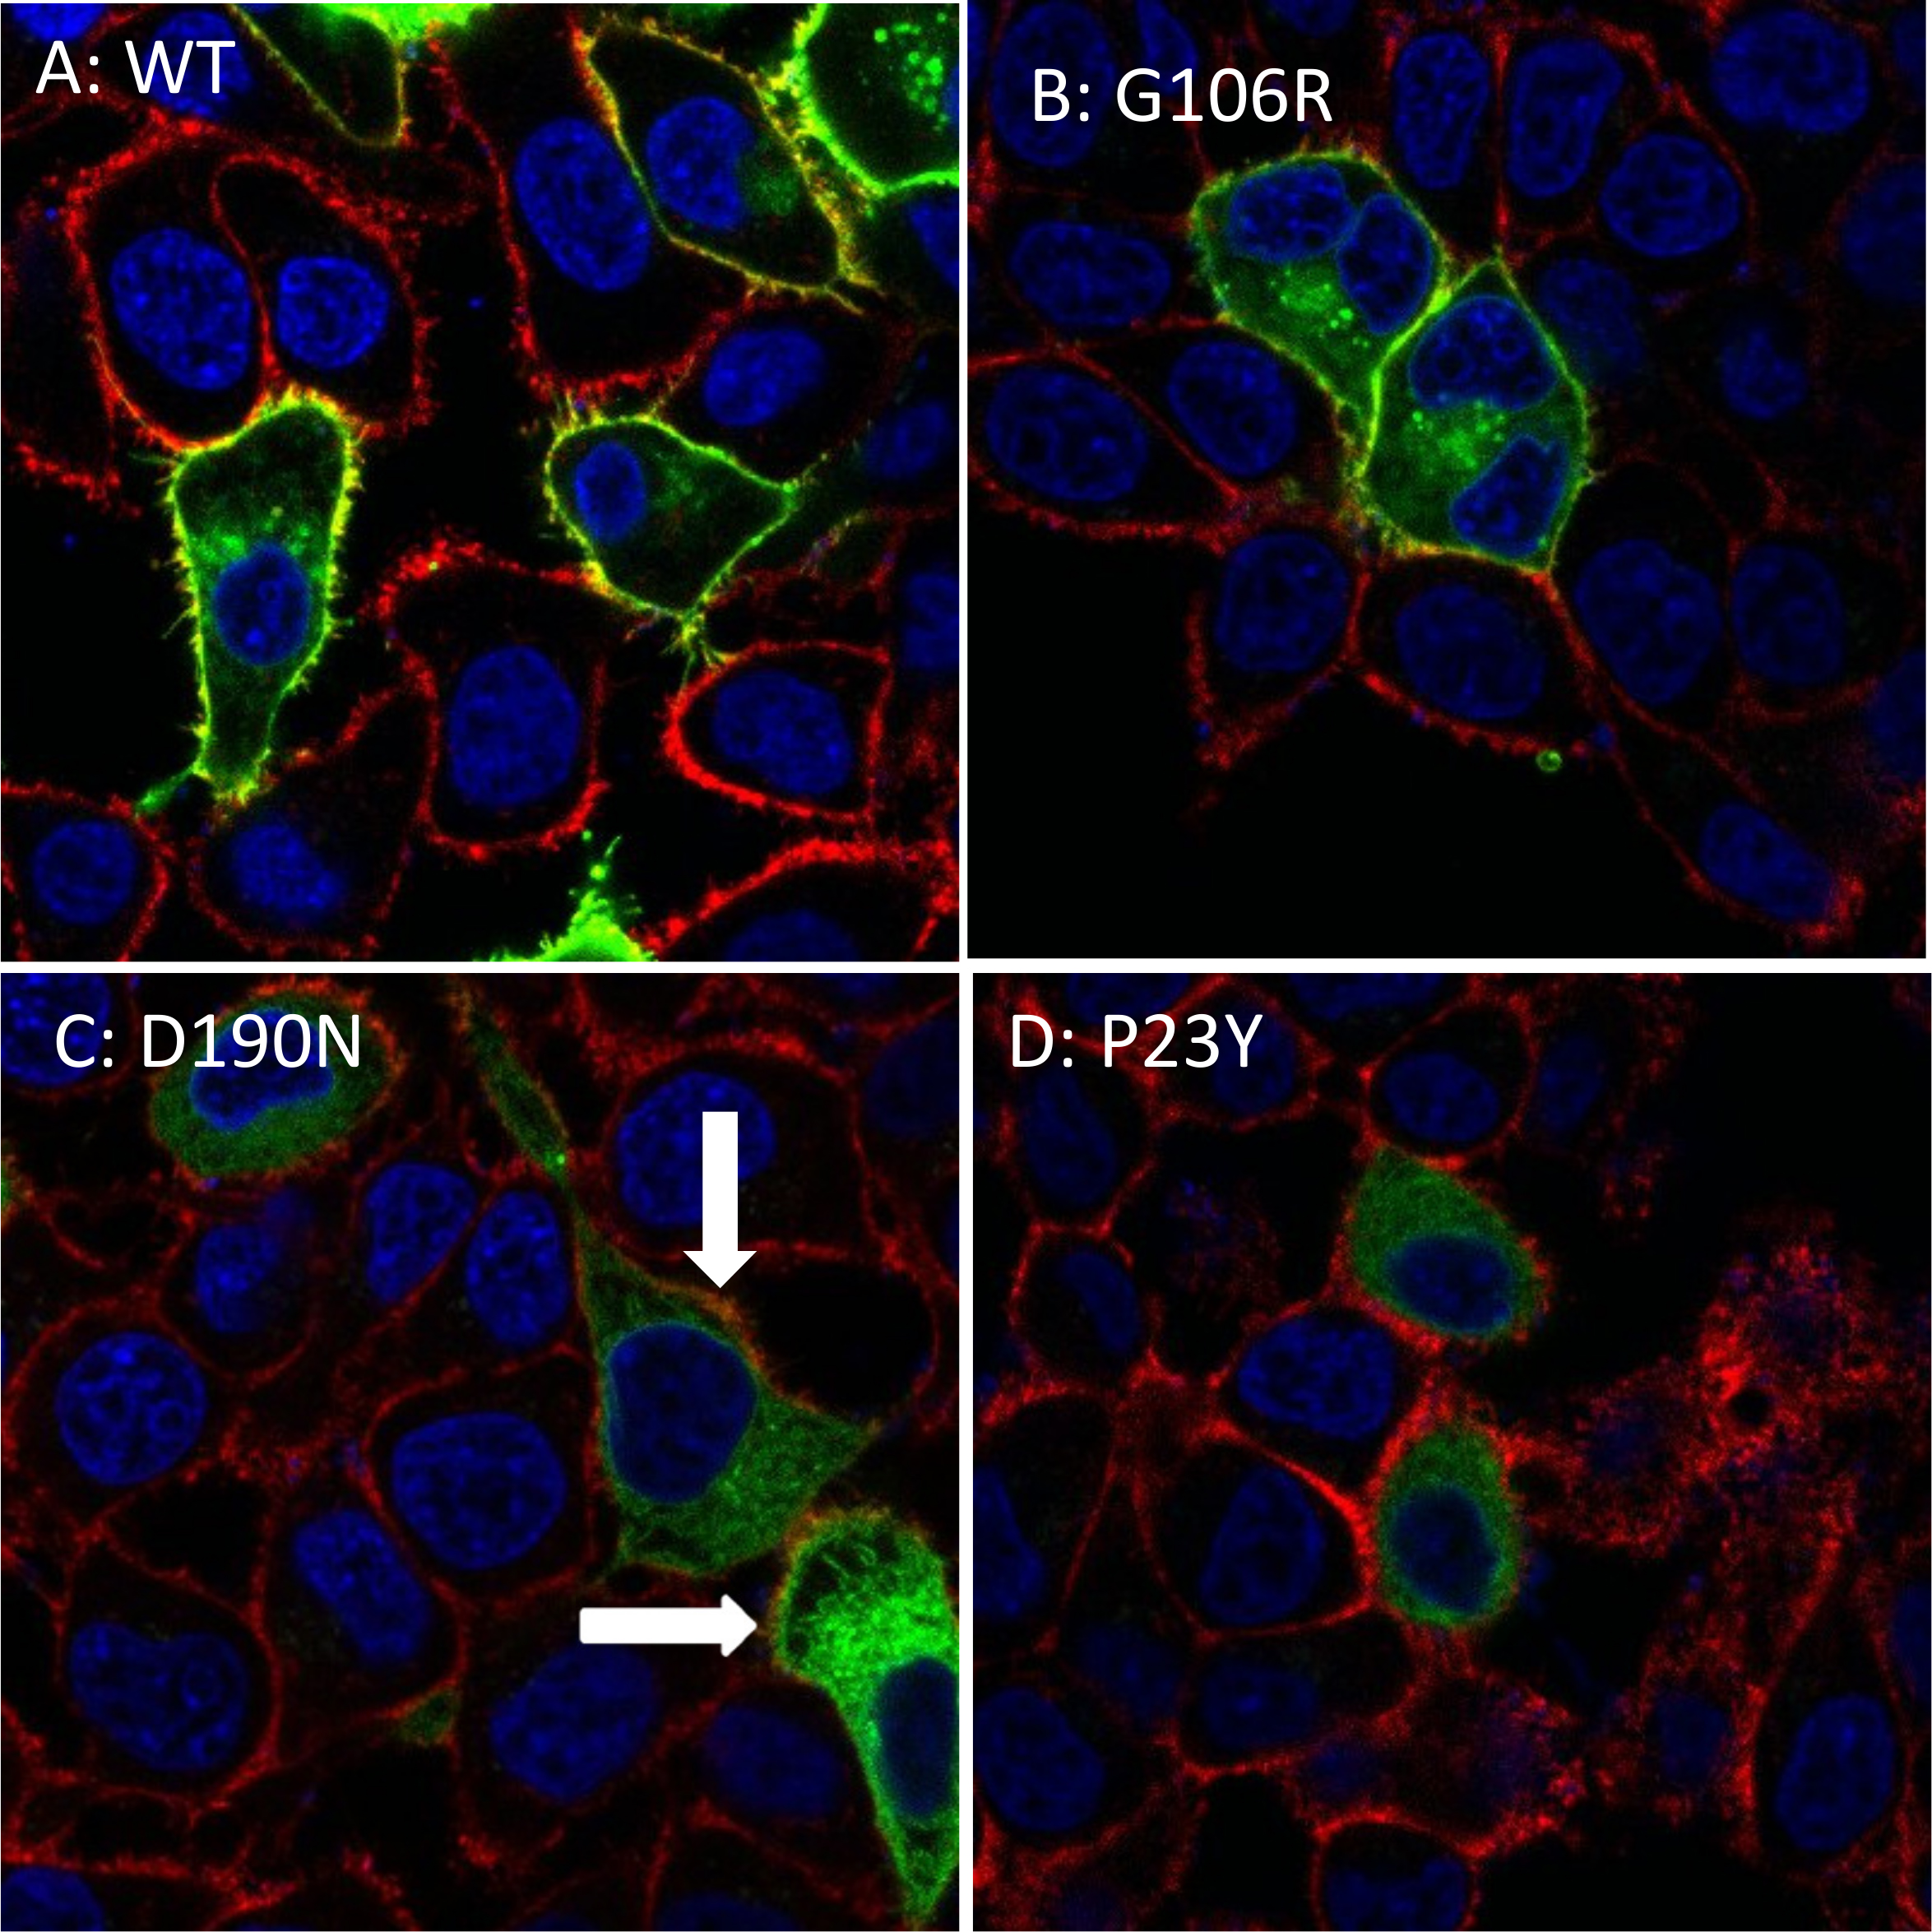
 Figure 7 of
McKeone, Mol Vis 2014; 20:183-199.
Figure 7 of
McKeone, Mol Vis 2014; 20:183-199.