Figure 6. Correlation between rhodopsin variant stability and its presence at the cell surface. The relationship between the stability
change predicted by FoldX and relative levels of membranous rhodopsin. A: APC-Cy7 fluorescence intensity of transfected cells normalized to wild-type. Data points represent means from five different
transfections, error bars represent standard deviation, and the range of APC-Cy7 intensity produced by the secondary antibody
control is shown between the two dotted horizontal lines. B: A comparison of the flow cytometry and image analysis data for examining the ratio between surface antibody signaling and
the green fluorescent protein (GFP) signal. C: Tukey/Kramer post-hoc analysis of ANOVA analysis to examine the significance of the difference between wild-type normalized
APC-cy7 and green fluorescent protein (GFP) ratios for the different mutant variants *=p<0.05; **=p<0.01. APC-Cy7 intensity
showed a sharp drop at small stability changes. The surface expression of rhodopsin was significantly higher in the wild-type,
G106R, and D190N than the other mutant variants, which expressed minimal levels of surface rhodopsin when ΔΔG was greater
than D190N (2.26 kcal/mol). D: Tukey-Kramer post-hoc analysis of mutant GFP intensities, normalized to the wild-type. Overall, GFP intensity was more consistent
between mutant transfections than was APC-Cy7 intensity. P23K transfections exhibited significantly lower GFP intensities
than P23Y or D190N (p<0.05), but there were no other significant differences between any of the other variants in terms of
GFP expression.
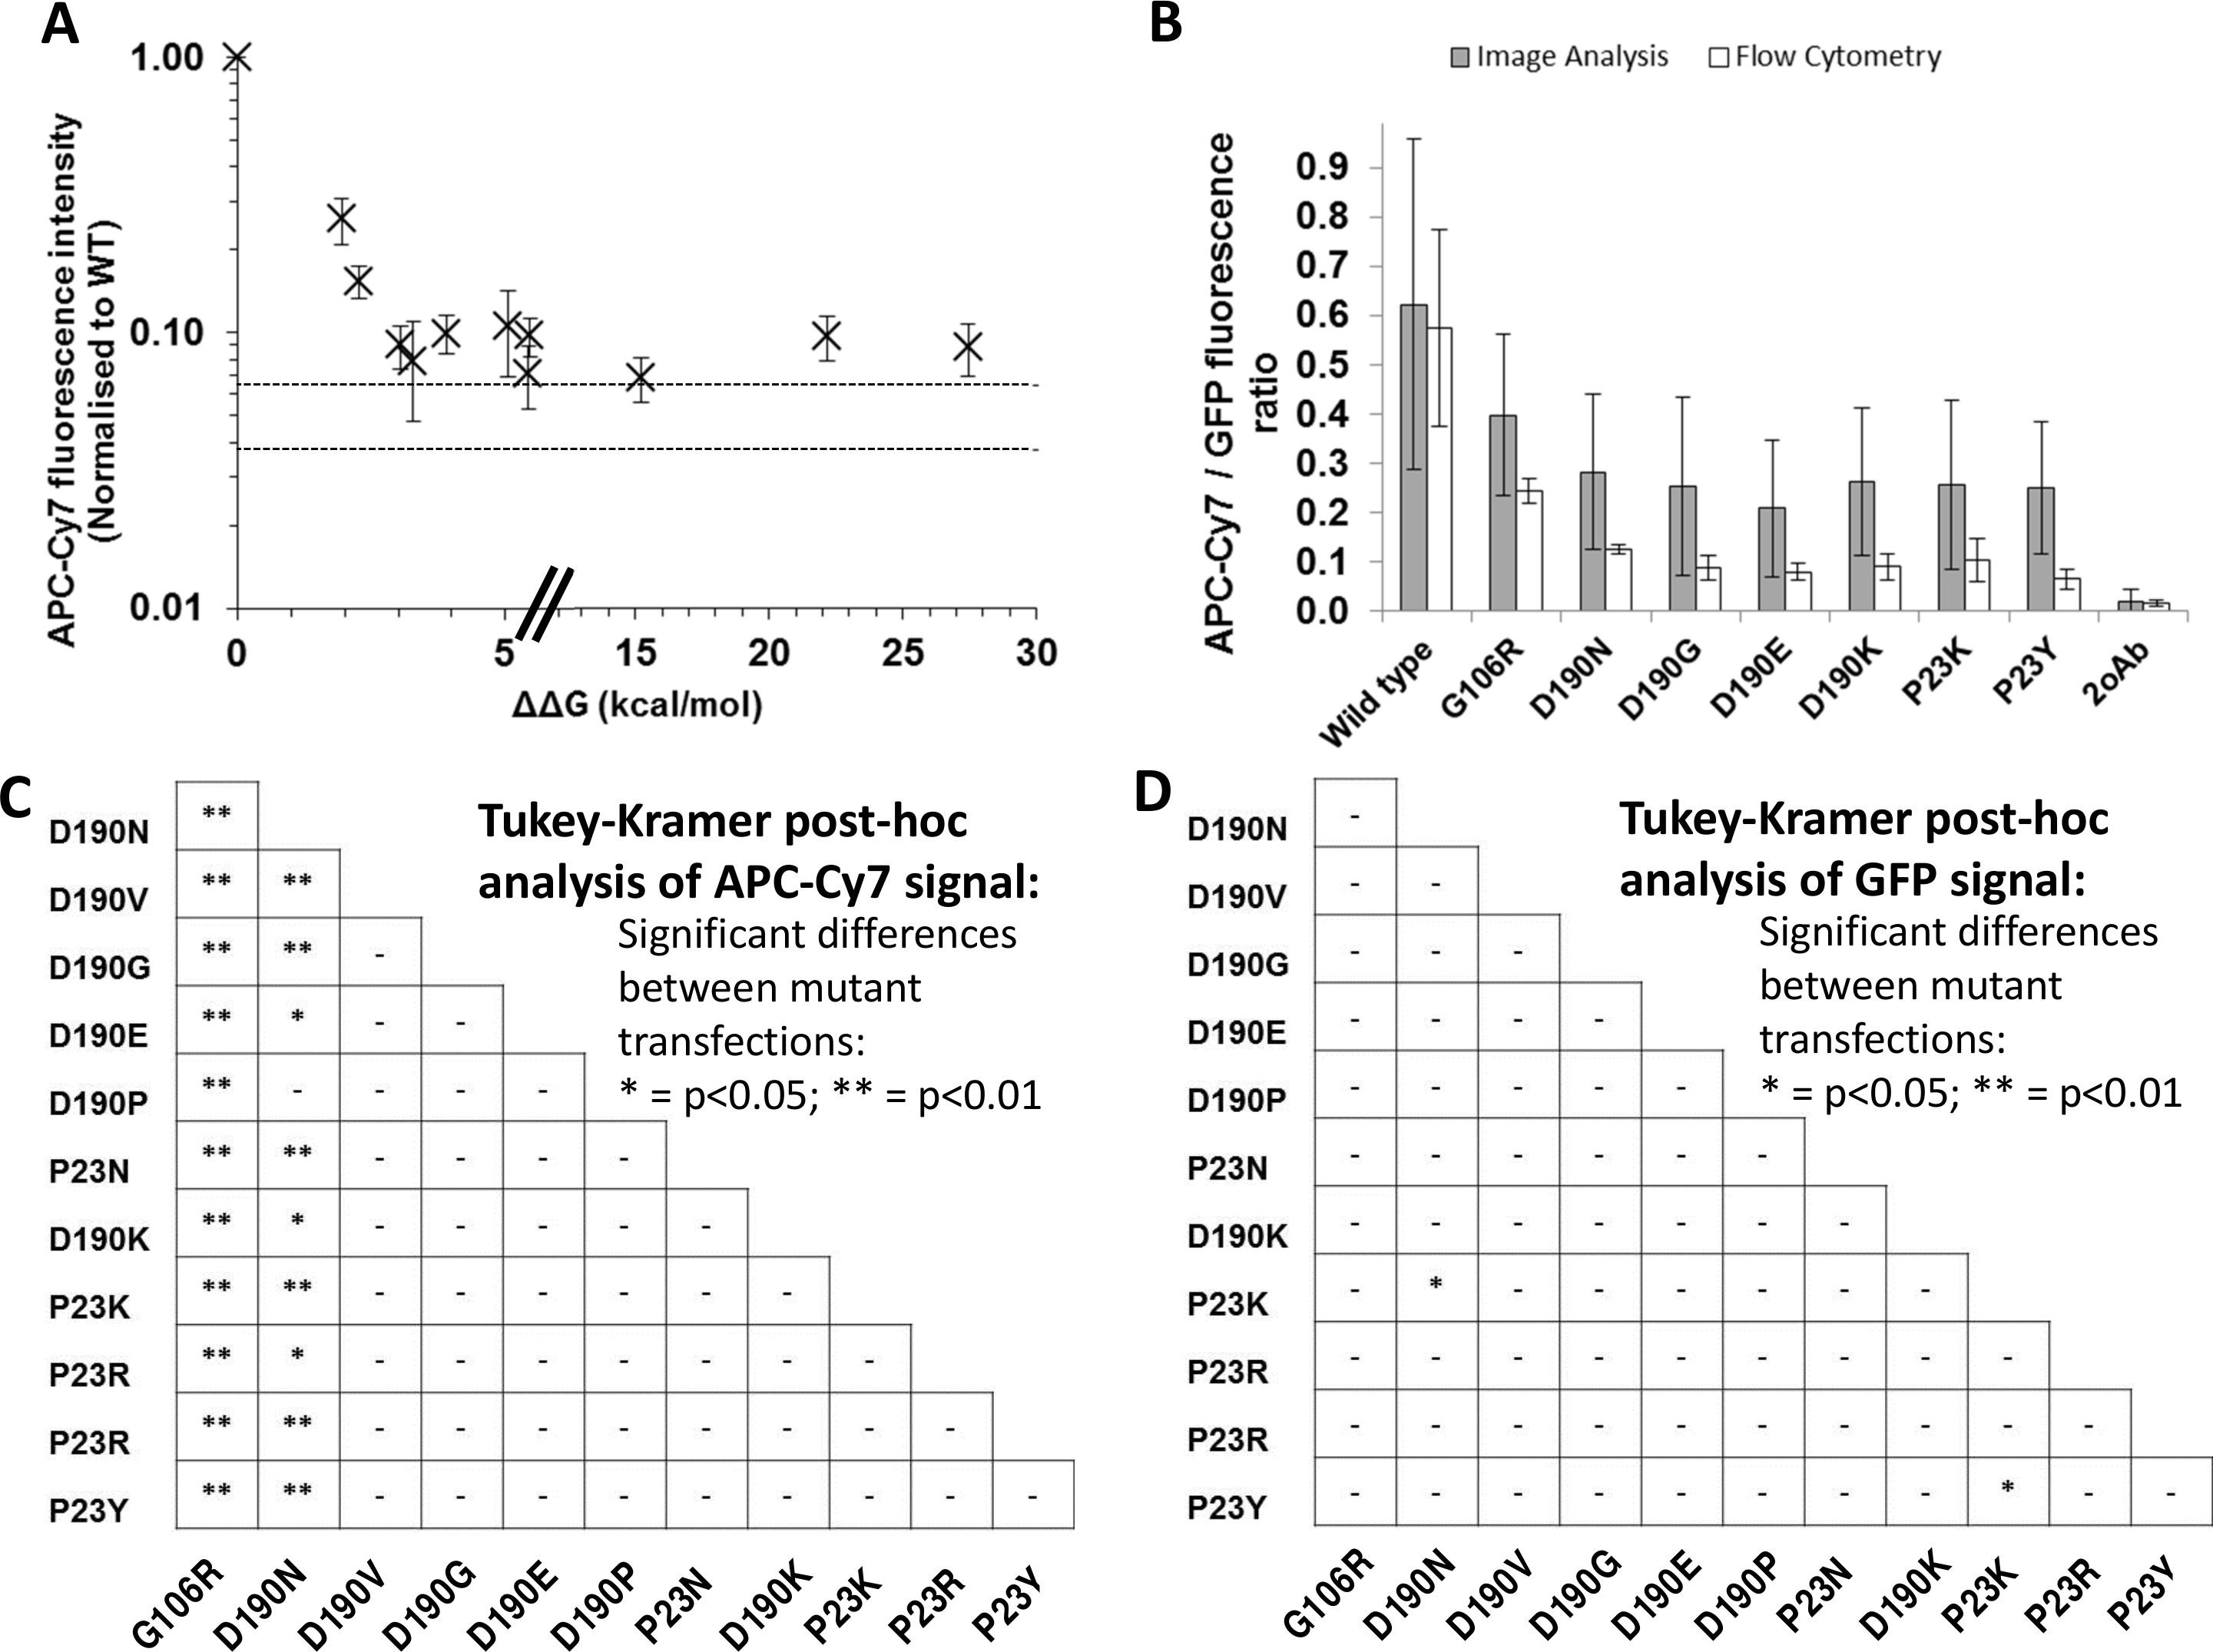
 Figure 6 of
McKeone, Mol Vis 2014; 20:183-199.
Figure 6 of
McKeone, Mol Vis 2014; 20:183-199.