Figure 5. Flow cytometry of HEK-293 cells transfected with RHO-AC-mGFP. Top row: Flow cytometry allows one to investigate the relationship
between total levels of rhodopsin (green fluorescent protein [GFP] intensity) and levels of rhodopsin at the cell surface
(APC-Cy7). Here are shown wild-type transfections (A) and transfections of the G106R variant (B). A control sample treated with the secondary detection antibody alone (C) is shown for comparison of APC-Cy7 intensities. Two discrete populations can be seen in each culture, with transfected cells
at high GFP levels (boxed region) versus non-transfected cells. Bottom row: Histograms showing the relative intensity of rhodopsin
expression at the cell surface (D–E) compared to controls treated with the secondary detection antibody alone (F).
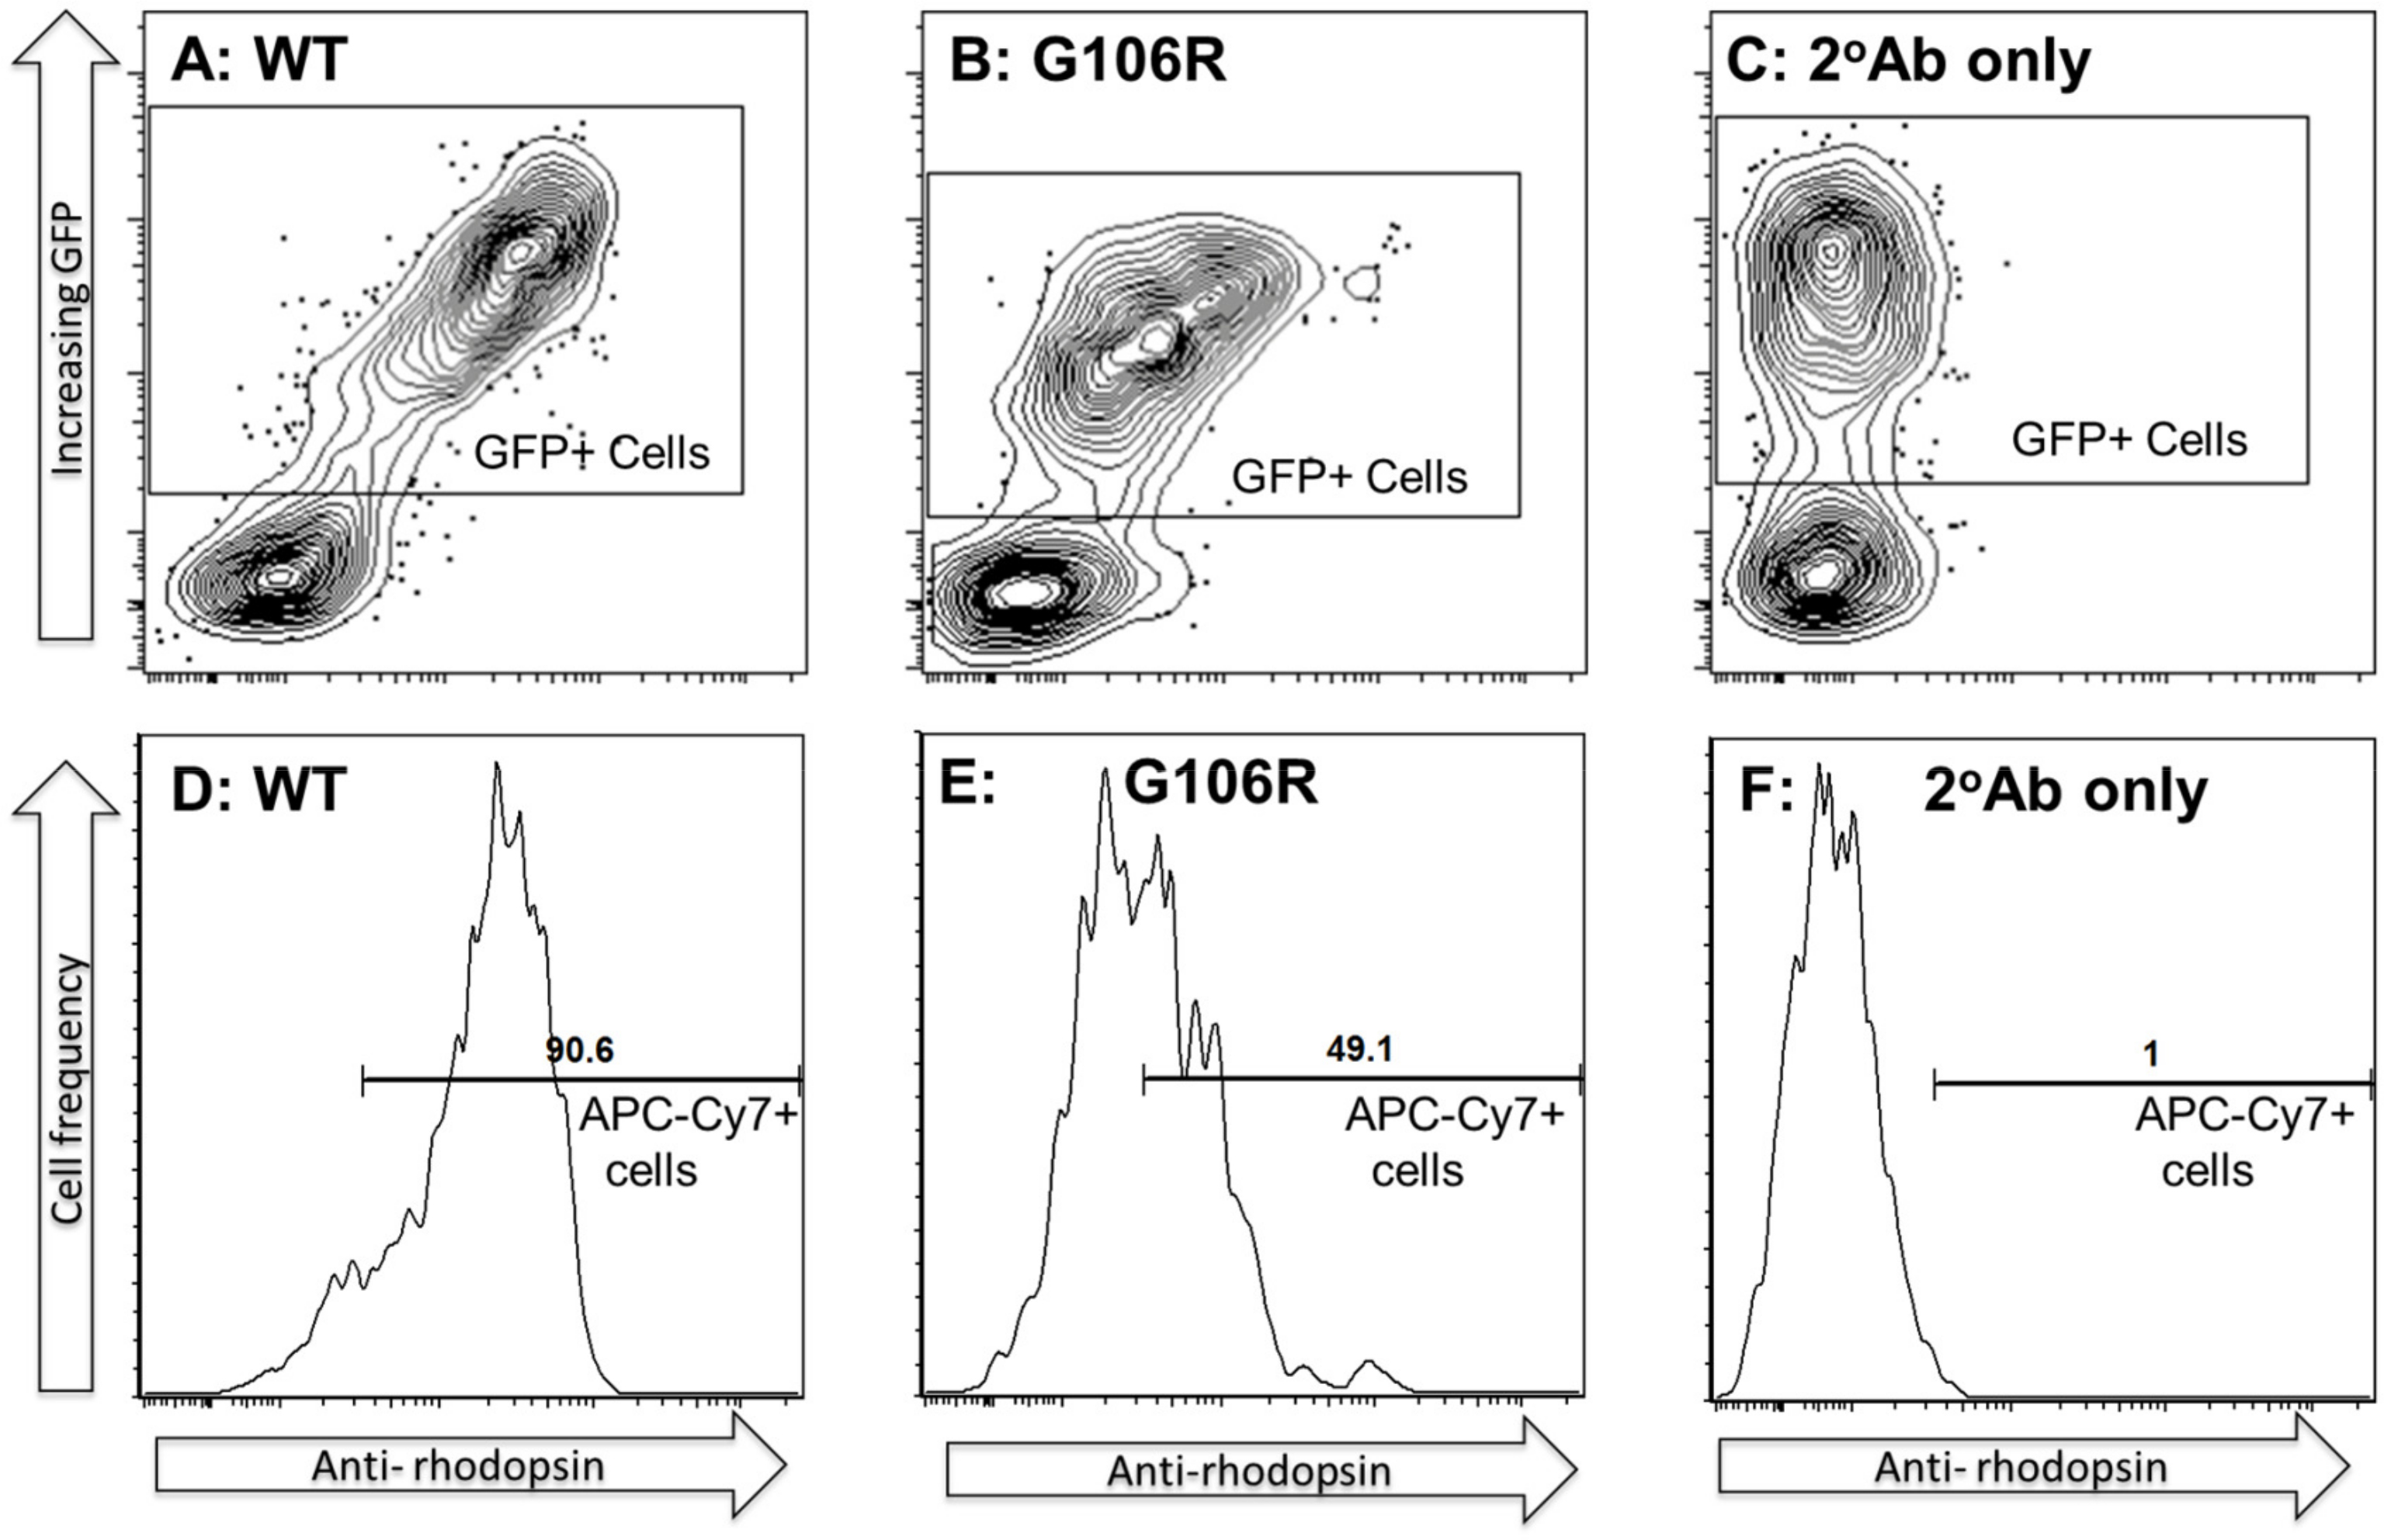
 Figure 5 of
McKeone, Mol Vis 2014; 20:183-199.
Figure 5 of
McKeone, Mol Vis 2014; 20:183-199.