Figure 6. Superimposed wild-type and mutant CYP4V2 and electrostatic potential differences between WT and Y343D. A: Wild-type CYP4V2 (72–523; pink) and CYP4V2 (72–523) Y343D (blue) is shown on the right. The typically disturbed secondary structures are magnified for detail. B: Blue denotes a positive charge, and red denotes a negative charge. The arrows indicate the charge distribution change region
on the molecular surface in the mutants and the wild type (WT).
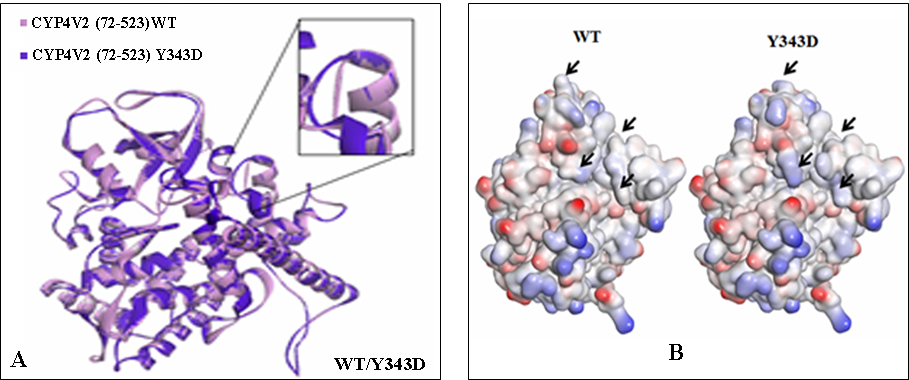
 Figure 6 of
Meng, Mol Vis 2014; 20:1806-1814.
Figure 6 of
Meng, Mol Vis 2014; 20:1806-1814.