Figure 5. Detection of apoptotic and necrotic RGCs in glutamate and astaxanthin. Representative fluorescence microscopy of Hoechst 33,342
and annexin V/propidium iodide staining at 72 h under glutamate-induced retinal ganglion cell (RGC) death. A: Green staining is annexin V-positive cells. B: Red staining is propidium iodide-positive staining cells. C: Blue staining is Hoechst 33,342-positive staining cells. D: Merged image; annexin V(+)/propidium iodide (-) apoptotic cells (white arrow) and annexin V(+)/propidium iodide(+) necrotic
cells (yellow arrow) are detectable. E: Ratio of apoptotic cells. Glutamate 25 µM increased the percentage of apoptotic cells. Astaxanthin (AST) 100 nM significantly
decreased apoptotic cells induced by glutamate. F: Ratio of necrotic cells. No significant difference was observed in all groups. Each value represents mean ± standard deviation
(SD; n=5). Asterisks indicate p<0.01 (Wilcoxon rank-sum test).
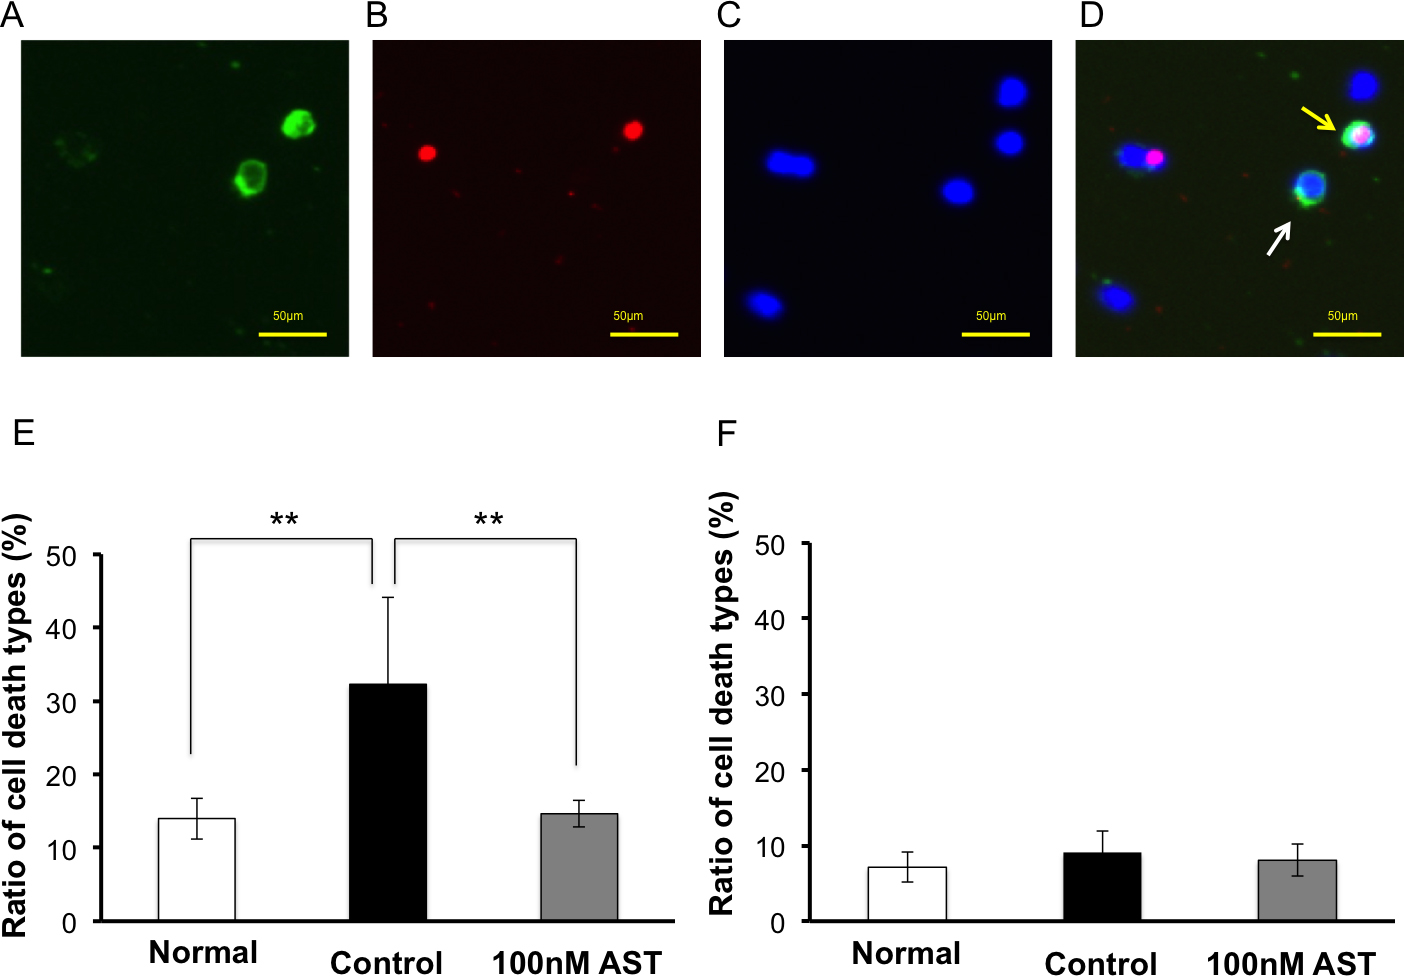
 Figure 5 of
Yamagishi, Mol Vis 2014; 20:1796-1805.
Figure 5 of
Yamagishi, Mol Vis 2014; 20:1796-1805.