Figure 1. Fluorescent images of rat purified RGC cultures exposed to glutamate with or without astaxanthin. Live cells were stained
green with calcein-AM and dead cells were red by ethidium homodimer-1. A: Non-treated control. B: Magnified figure of A.C: 25 μM glutamate only. D: 25 μM glutamate + 100 nM astaxanthin. E: 25 μM glutamate + 10 nM astaxanthin. F: 25 μM glutamate + 1 nM astaxanthin.
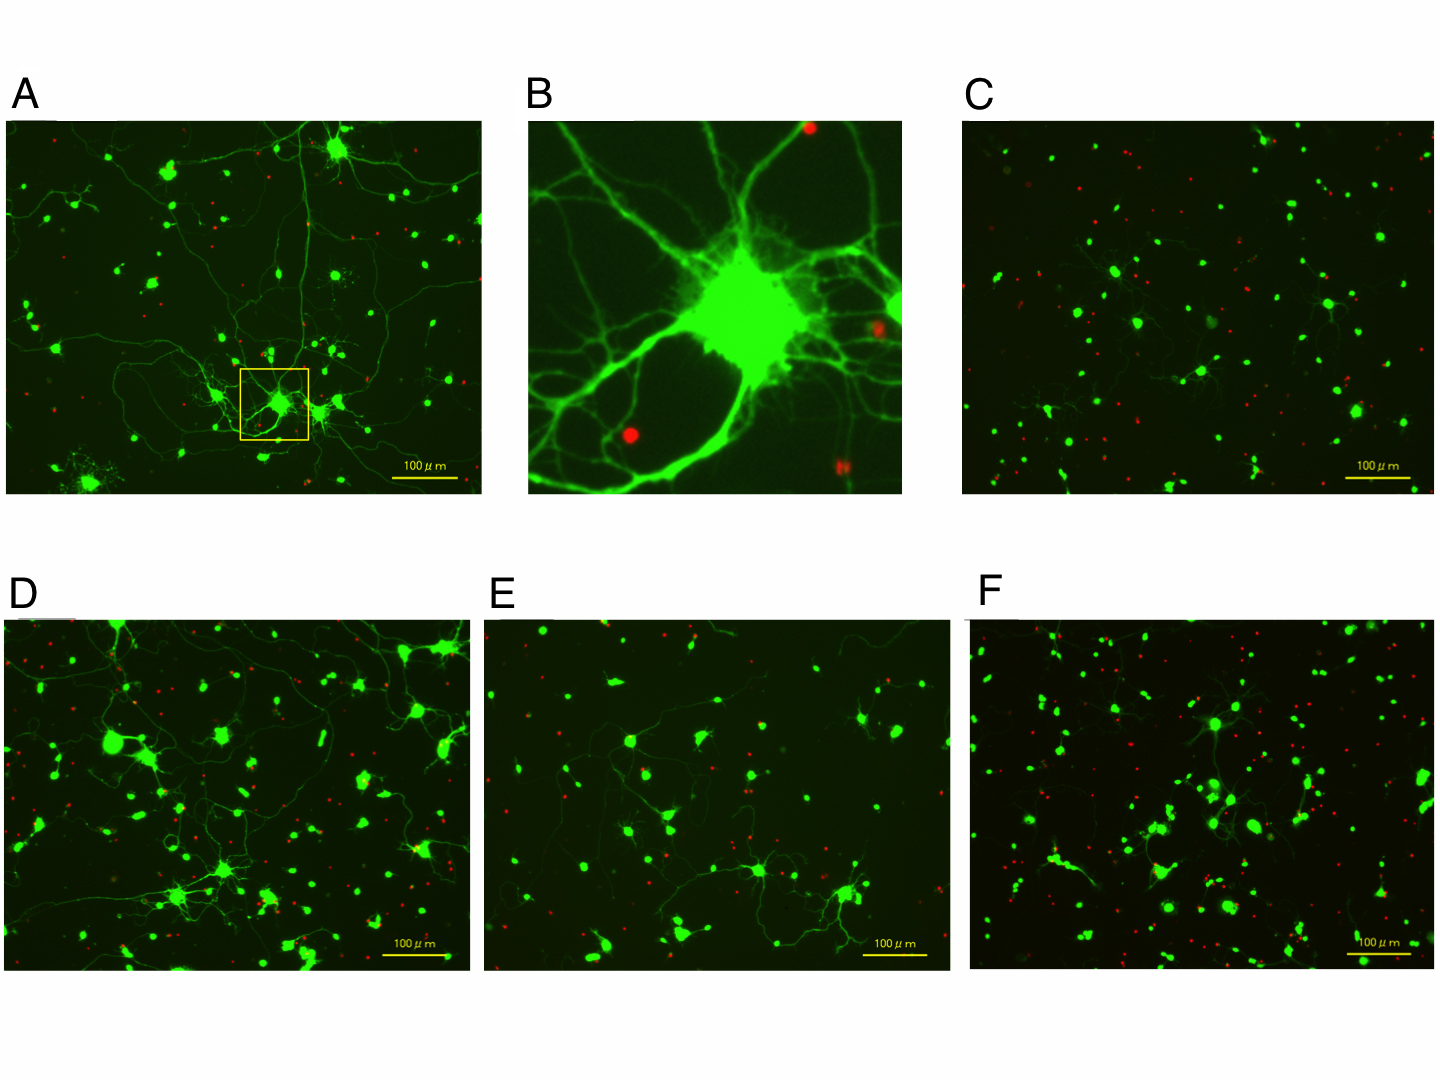
 Figure 1 of
Yamagishi, Mol Vis 2014; 20:1796-1805.
Figure 1 of
Yamagishi, Mol Vis 2014; 20:1796-1805.