Figure 4 of
Zobor, Mol Vis 2014; 20:178-182.
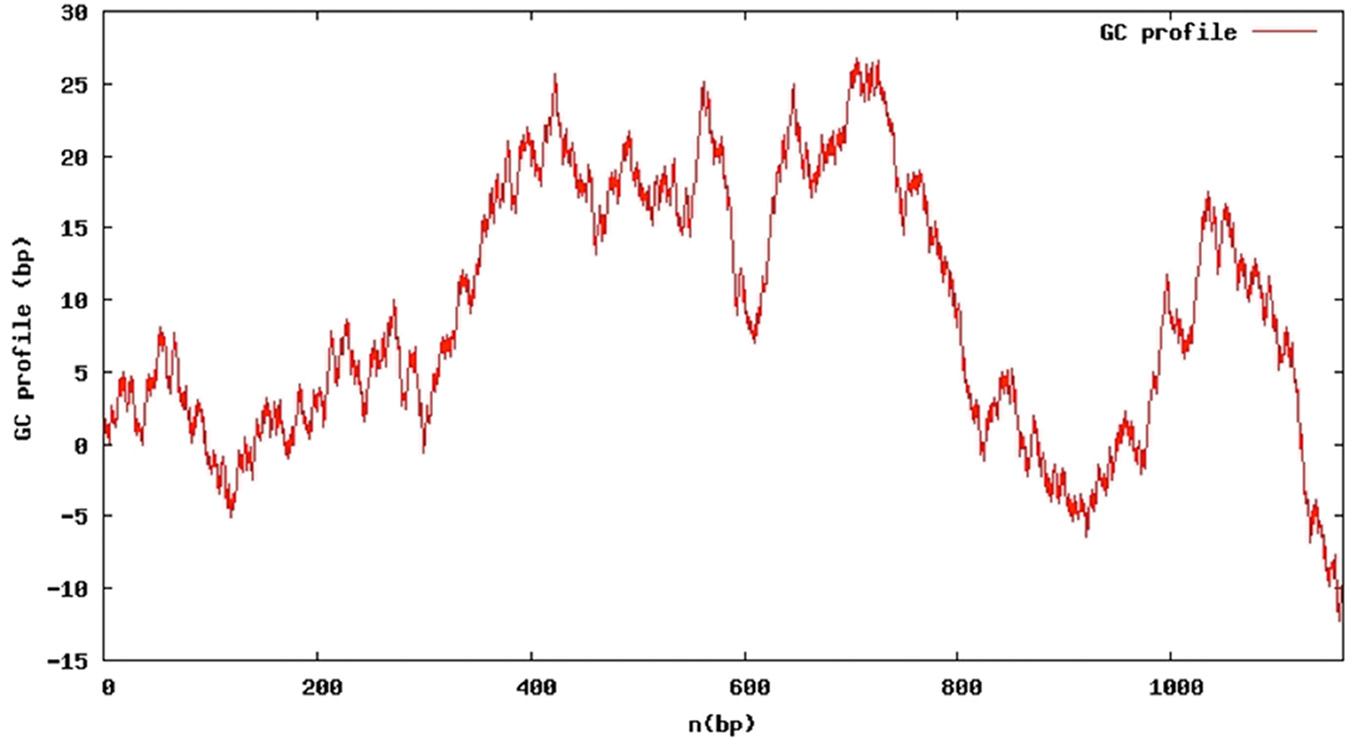
Figure 4.
GC profile of exon 3 of
FAM161A
. The GC profile shows local segments of significantly elevated GC content.
 Figure 4 of
Zobor, Mol Vis 2014; 20:178-182. Figure 4 of
Zobor, Mol Vis 2014; 20:178-182.
Figure 4 of
Zobor, Mol Vis 2014; 20:178-182. Figure 4 of
Zobor, Mol Vis 2014; 20:178-182.