Figure 7. Diagram summarizing the distribution of F-actin (shown in red; A-D) and cadherin (shown in blue; E-H) in the BMC of migrating fiber ends in RCS/Lav (dystrophic) rats. A, E: At 2 weeks old; B, F: at 4 weeks old; C, G: at 6 weeks old; D, H: at 8 weeks old. F-actin was initially distributed around the periphery of the BMC but by 4 weeks postnatal was altered such
that foci were visible at vertices. The F-actin foci became more prominent as the PSC developed and persisted through 8 weeks
postnatal in the majority of lenses. Cadherin was almost completely co-localized with F-actin in 2- and 4-week-old dystrophic
lenses; however, its distribution became increasingly diffuse and cytoplasmic during PSC progression.
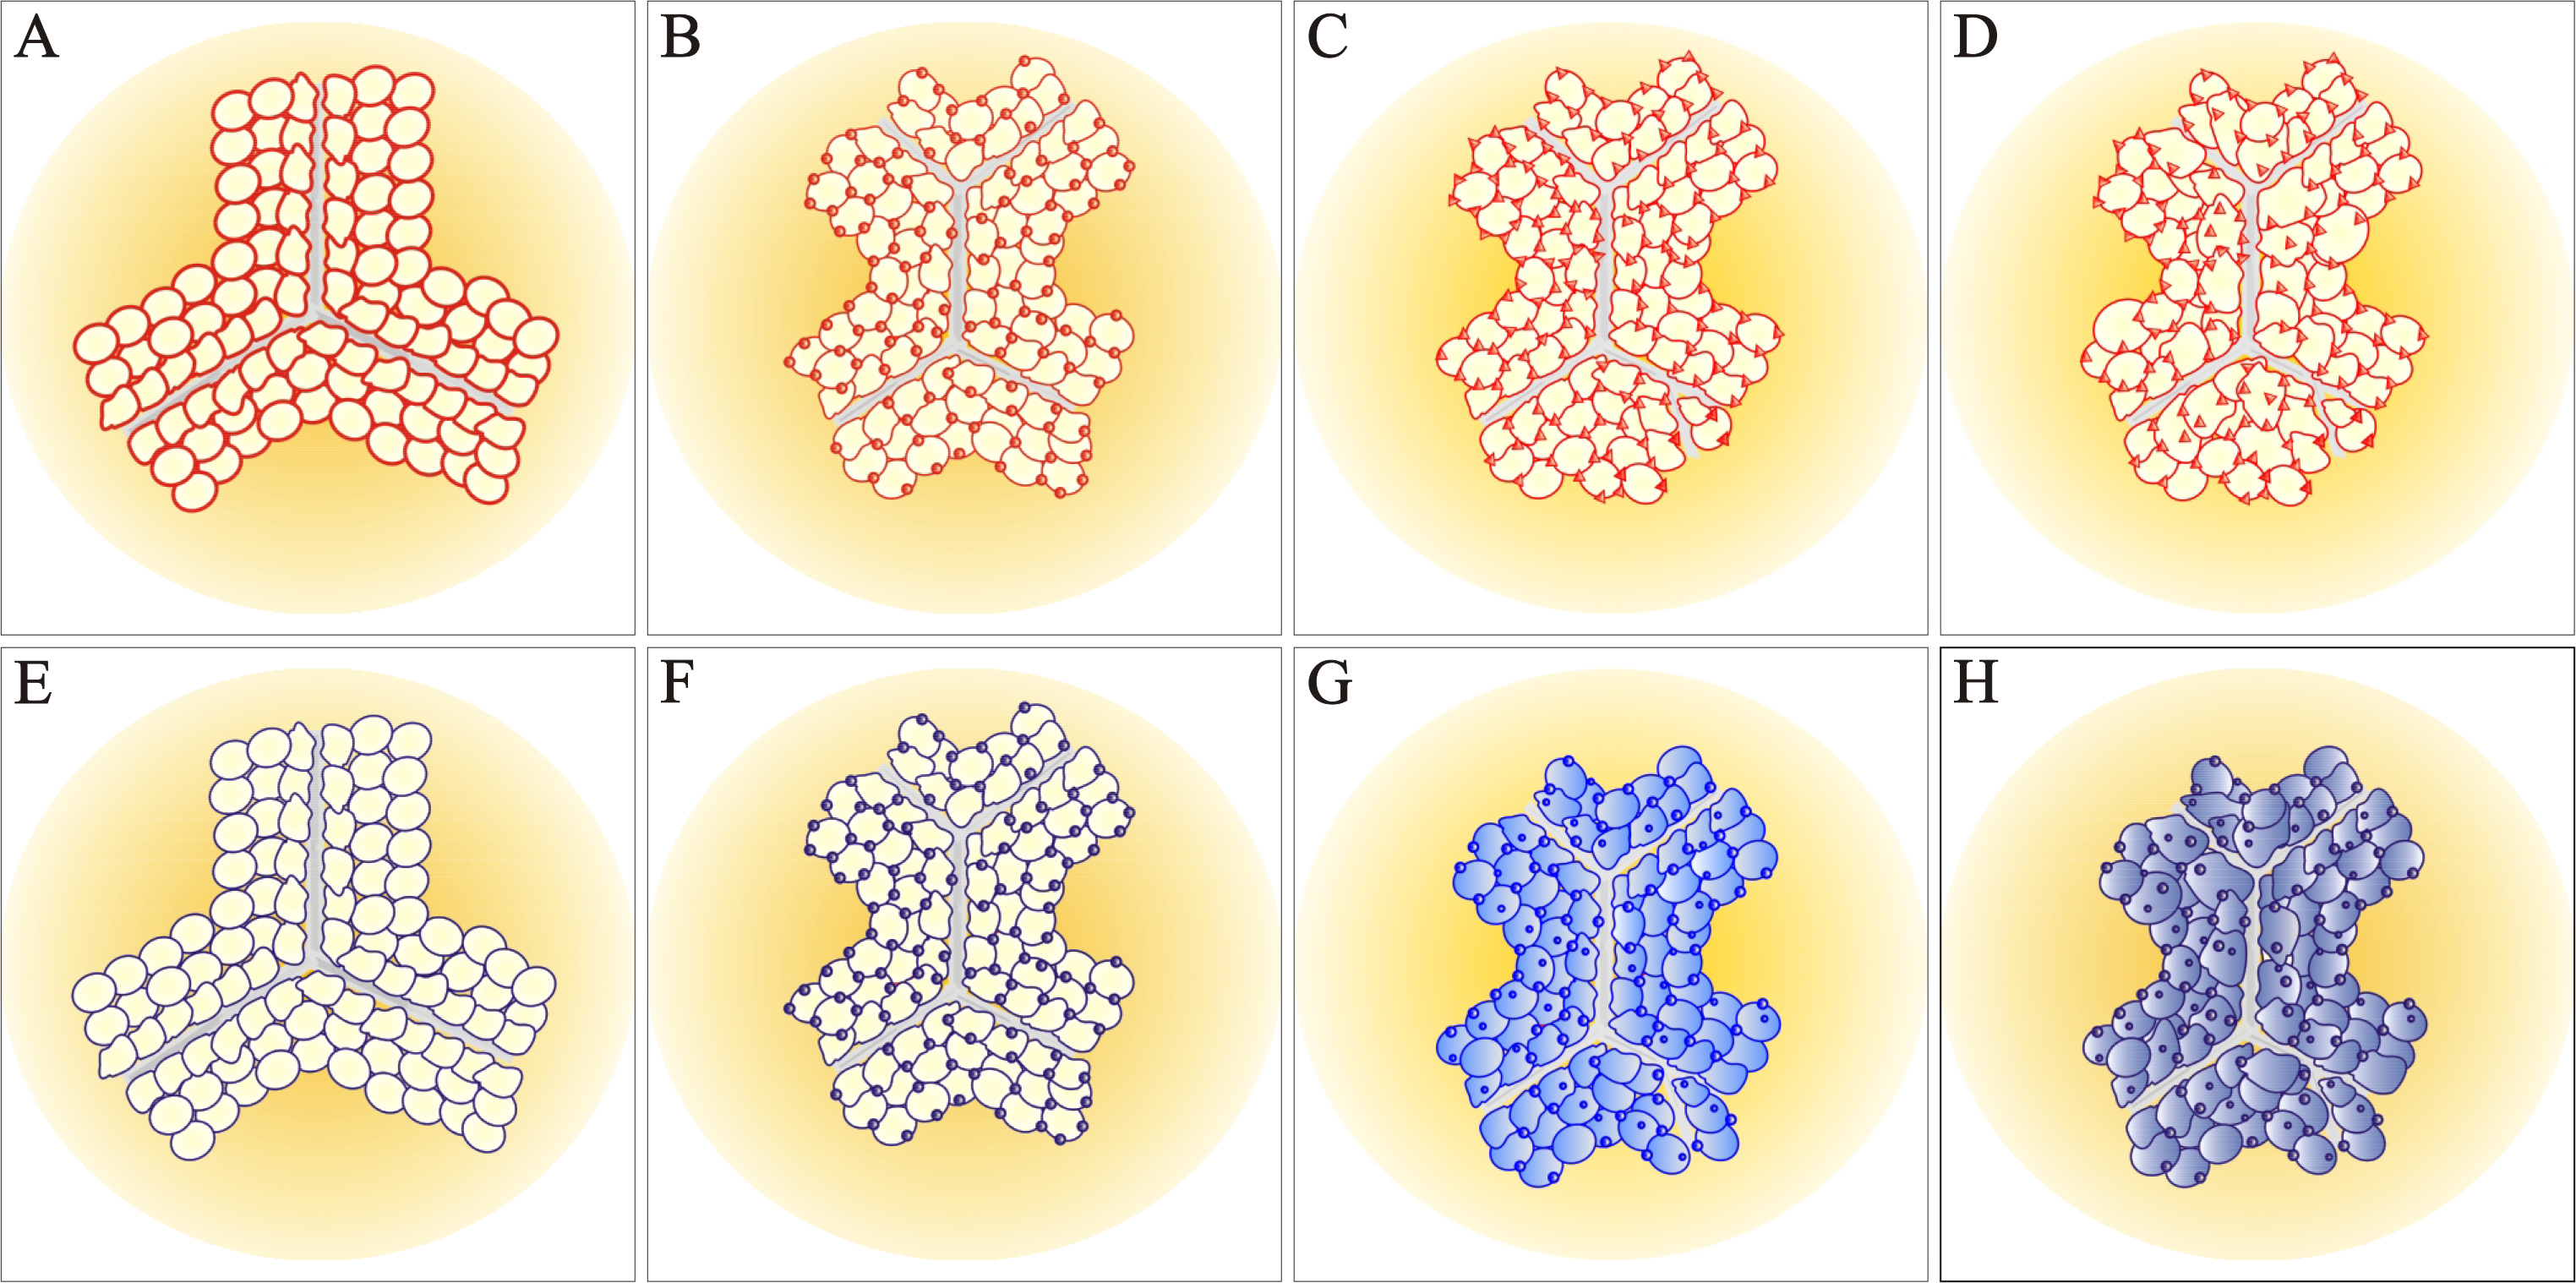
 Figure 7 of
Joy, Mol Vis 2014; 20:1777-1795.
Figure 7 of
Joy, Mol Vis 2014; 20:1777-1795.