Figure 6. LSCM images of typical RCS dystrophic lenses at 7–8 weeks postnatal. All images are viewed en face. A: In most lenses (~75%) the F-actin foci were noted within the PSC plaque. B: An optical section approximately 10 µm deep to the capsule–fiber interface. Fiber ends adjacent to and at posterior sutures
(dashed white lines) were excessively dilated, resulting in disruption of sutures deep to the migrating fiber ends. C: Cadherin distribution was comparable to 6-week-old lenses, i.e., it displayed a diffuse distribution (asterisks) in the BMC
with more pronounced punctate labeling at the periphery. D, E: The same field of view showing F-actin (D) and the merged F-actin/vinculin image (E). Extremely dilated fiber ends within the plaque frequently had a mottled labeling pattern for F-actin (stars) and weak punctate
fluorescence for vinculin around the periphery (arrowheads). Panels D and E are at the same magnification.
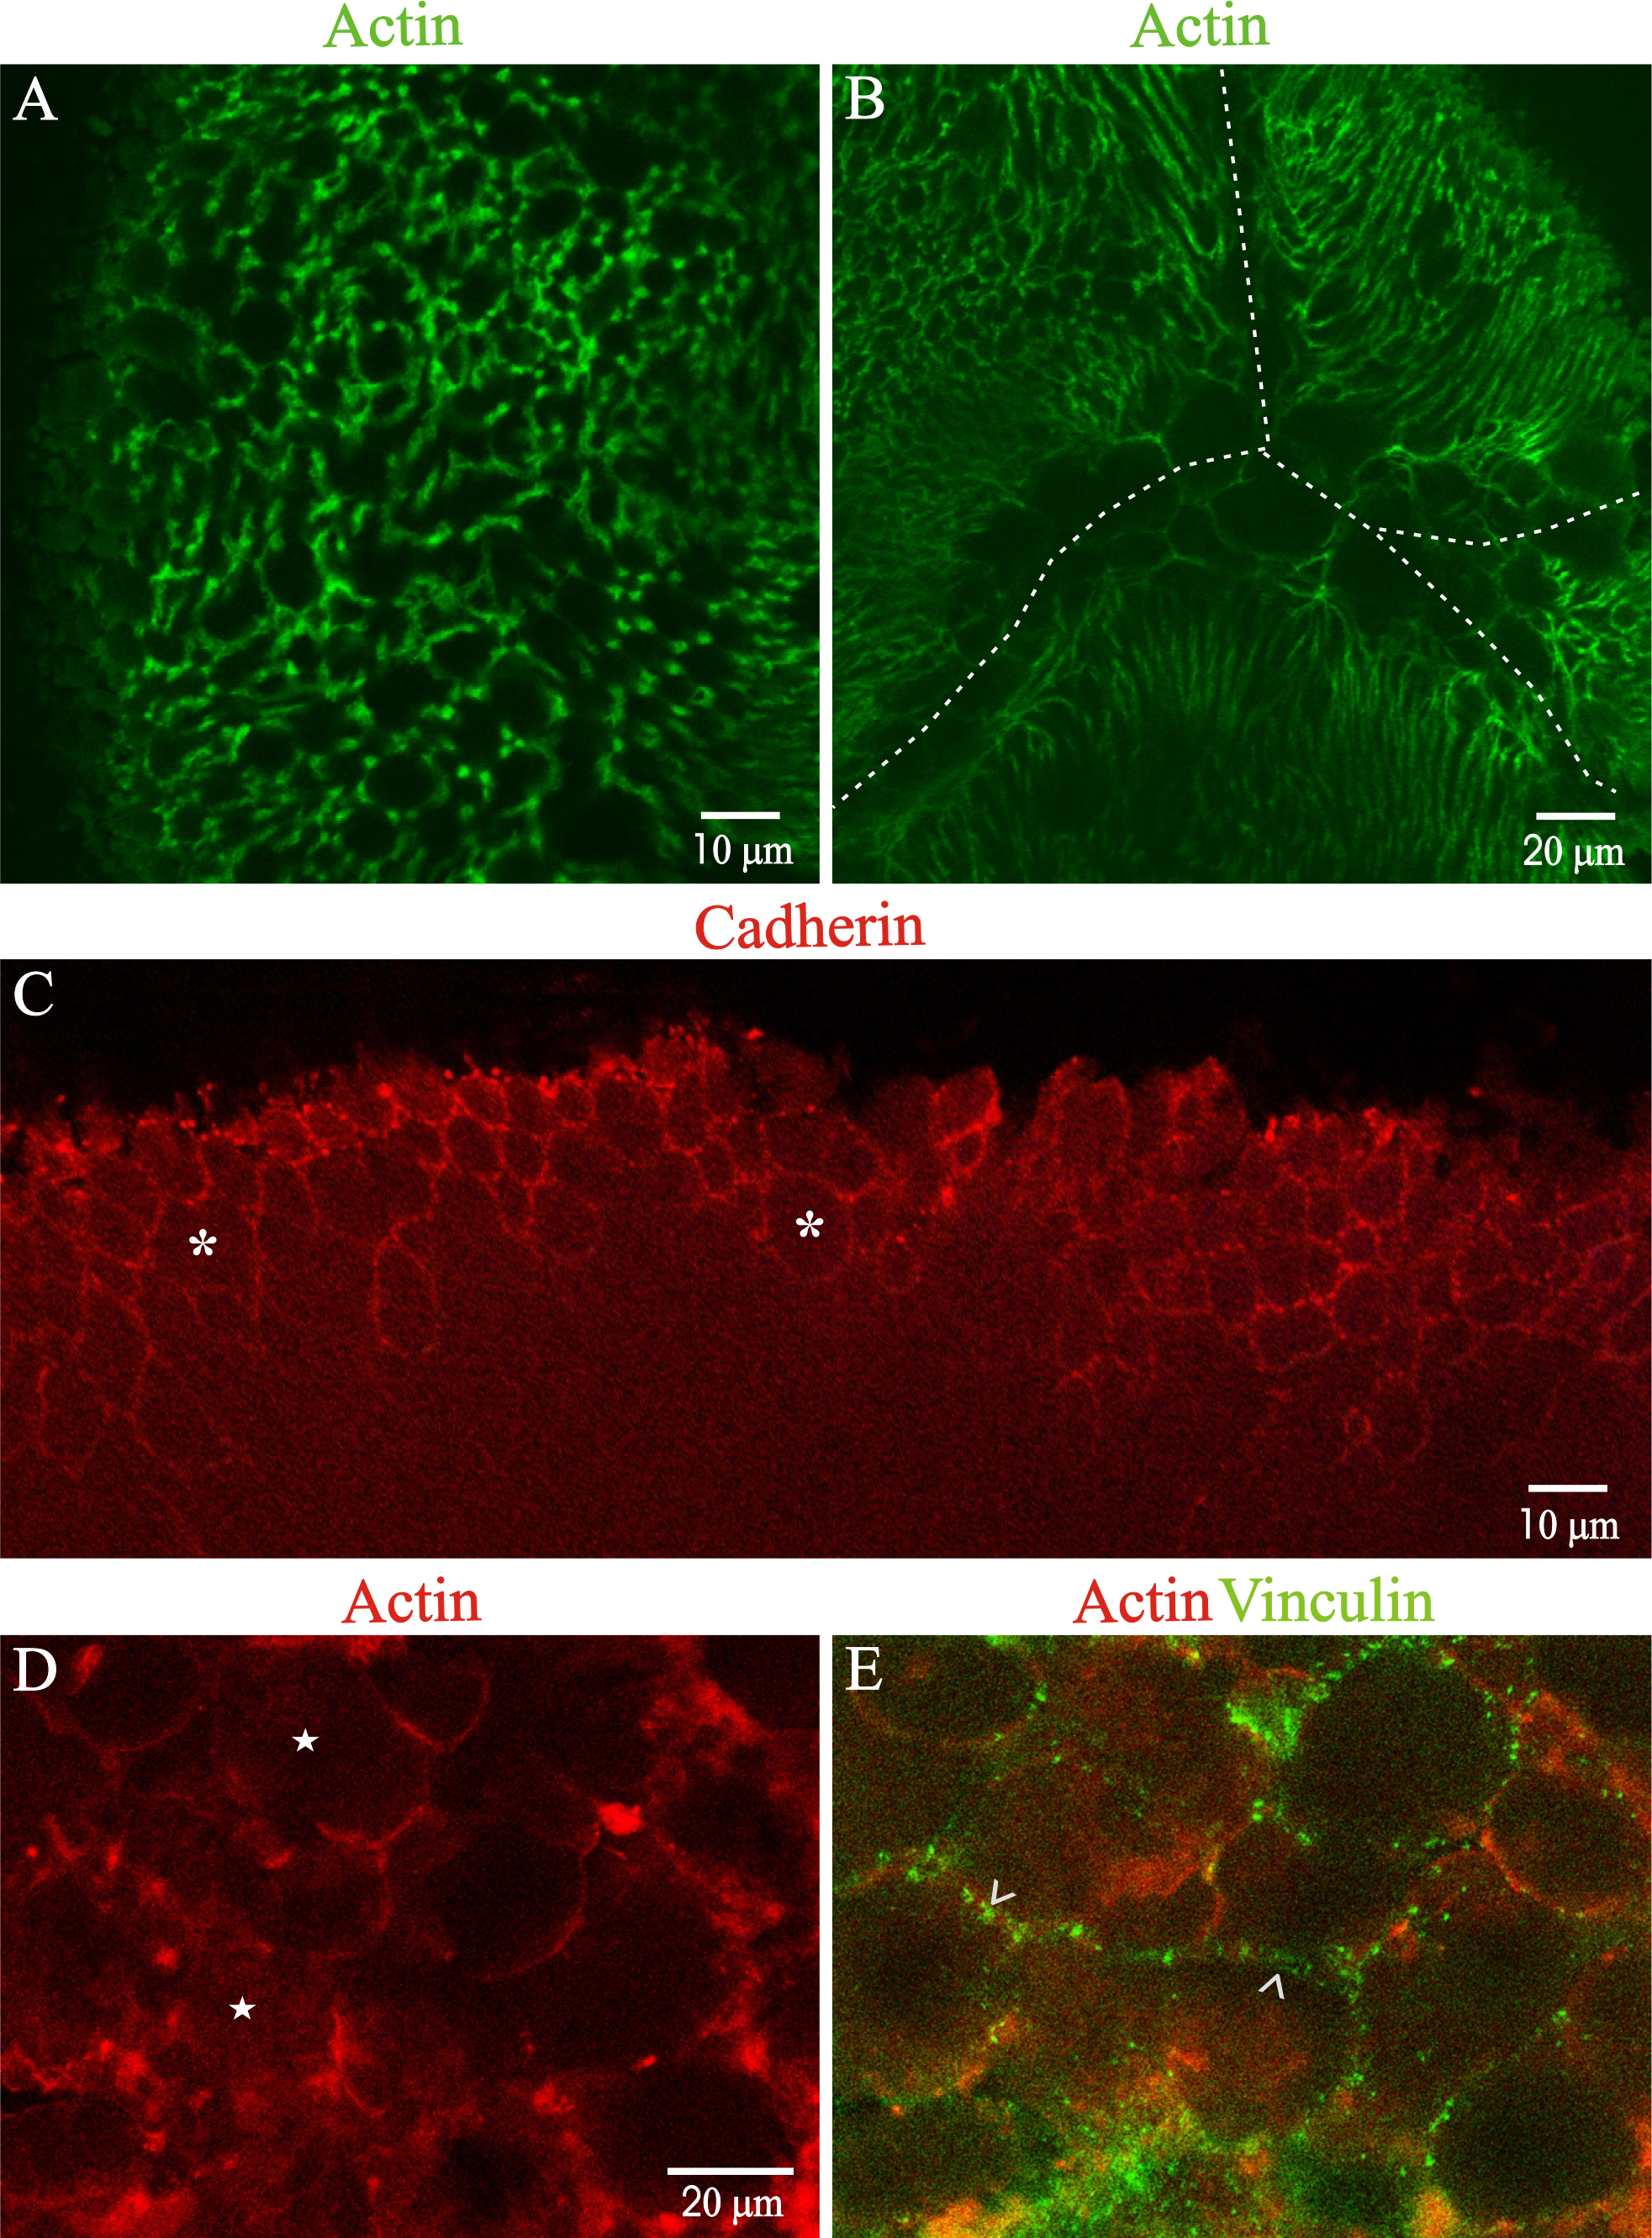
 Figure 6 of
Joy, Mol Vis 2014; 20:1777-1795.
Figure 6 of
Joy, Mol Vis 2014; 20:1777-1795.