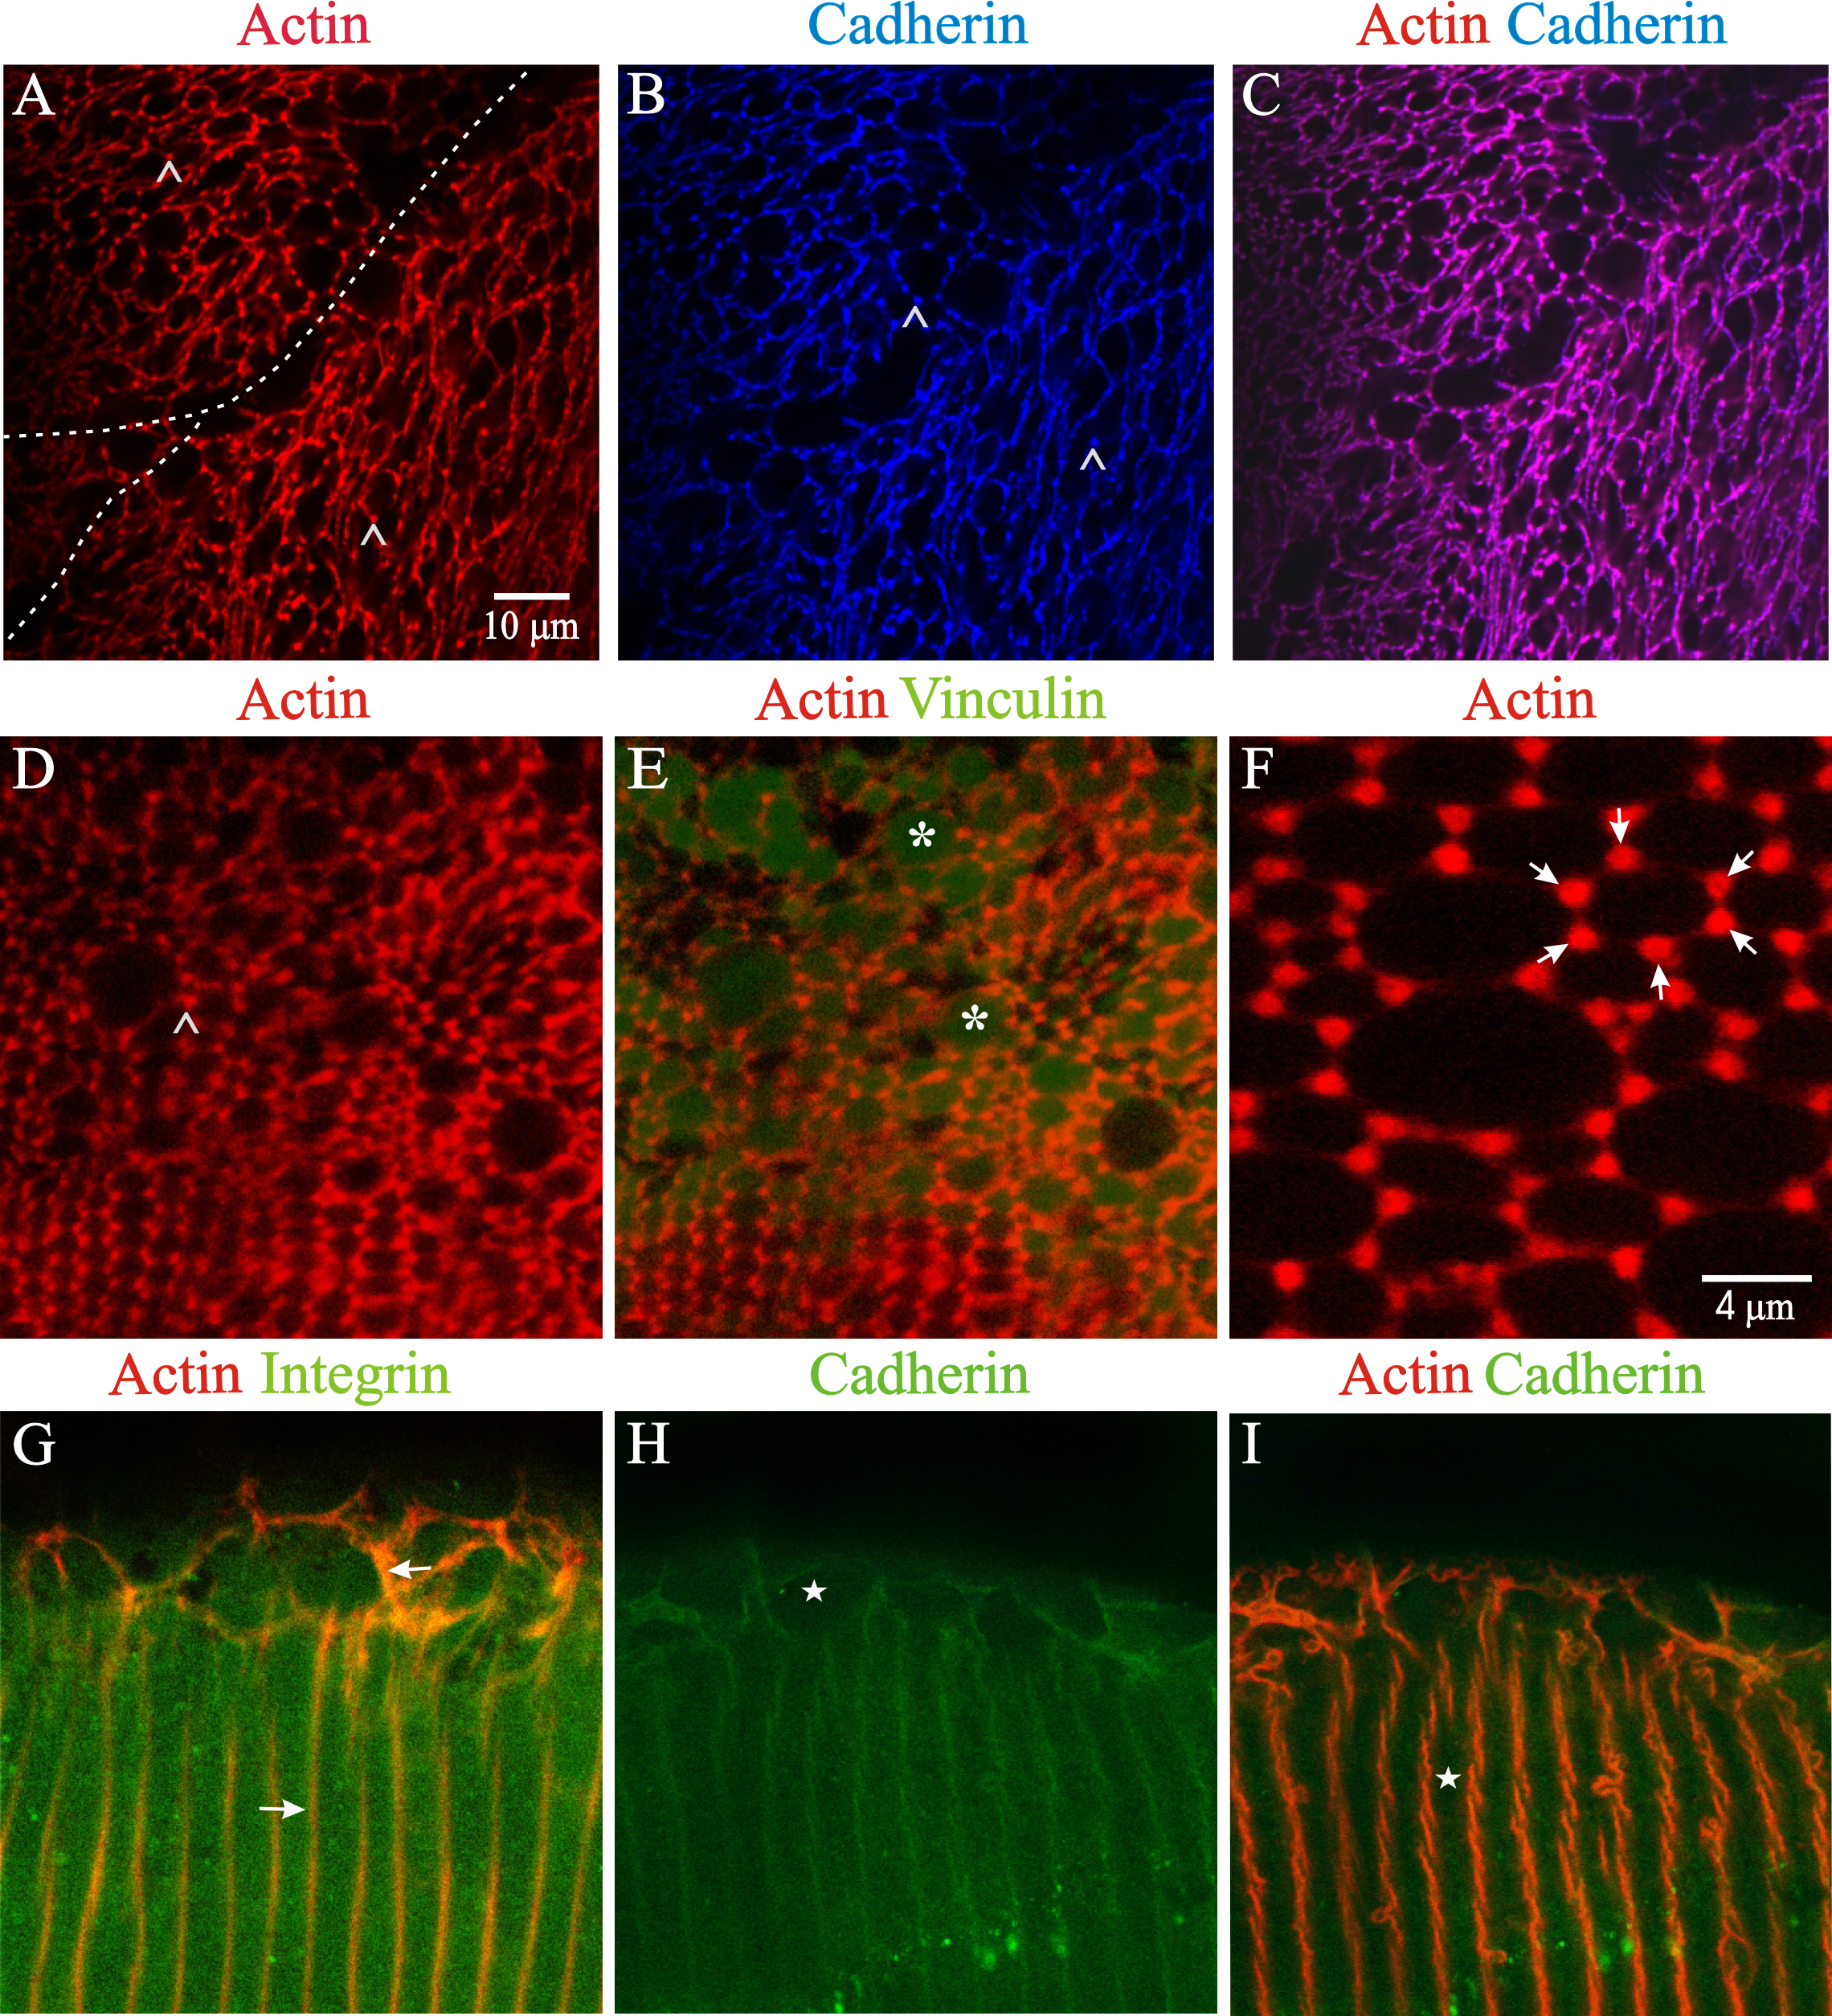
Figure 5. LSCM images of RCS dystrophic rat lenses at 4–6 weeks postnatal.
A, B, C: The same field of view showing an en face view of fiber ends in 4-week-old animals labeled for F-actin (
A, arrowheads), cadherin (
B, arrowheads), and the merged image (
C). F-actin and cadherin were almost completely co-localized (
C) around the perimeter of the BMC. The formation of the previously described F-actin foci [
21] was discernible. A portion of a suture branch with abnormal sub-branching is delineated by a dashed white line.
D, E: The same field of view showing F-actin (
D) and the merged F-actin/vinculin double label (
E) in the en face orientation. Within the forming PSC of 5-week postnatal animals, distinct F-actin foci (arrowheads) were
present around the BMC perimeter with vinculin rearranged as diffuse plaques (asterisks).
F: An en face view at high magnification clearly showed the rosette arrangement of F-actin (arrows) by 6 weeks postnatal.
G: An oblique optical section of a 6-week-old lens shows that β integrin had a diffuse distribution as well as a more pronounced
presence in the lateral membranes and BMC periphery (arrows), which was partially co-localized with F-actin.
H, I: The same field of view showing cadherin (
H) and the merged cadherin/actin (
I) double label in an oblique optical section from a 6-week-old lens. Similar to β integrin, cadherin showed a more dispersed
labeling pattern (stars) than at earlier time points. Panels
A–
E and
G–
I are at the same magnification.
 Figure 5 of
Joy, Mol Vis 2014; 20:1777-1795.
Figure 5 of
Joy, Mol Vis 2014; 20:1777-1795.