Figure 4. LSCM images of 2–3-week-old RCS/Lav (dystrophic) posterior fiber ends viewed en face. A, B, C: In dystrophic rat lenses from 2 to 3 weeks old, distribution of F-actin (A and C), vinculin (A), and cadherin (B) was comparable to controls; however, integrin distribution (C) was altered. Specifically, F-actin and cadherin outlined the BMC (A and B, arrows), whereas, vinculin was present in discrete spots (A, arrowheads). Controls displayed a plaque-like integrin distribution in the BMC, whereas dystrophics had a random punctuate
pattern (C, arrowheads). Panels A–C are at the same magnification.
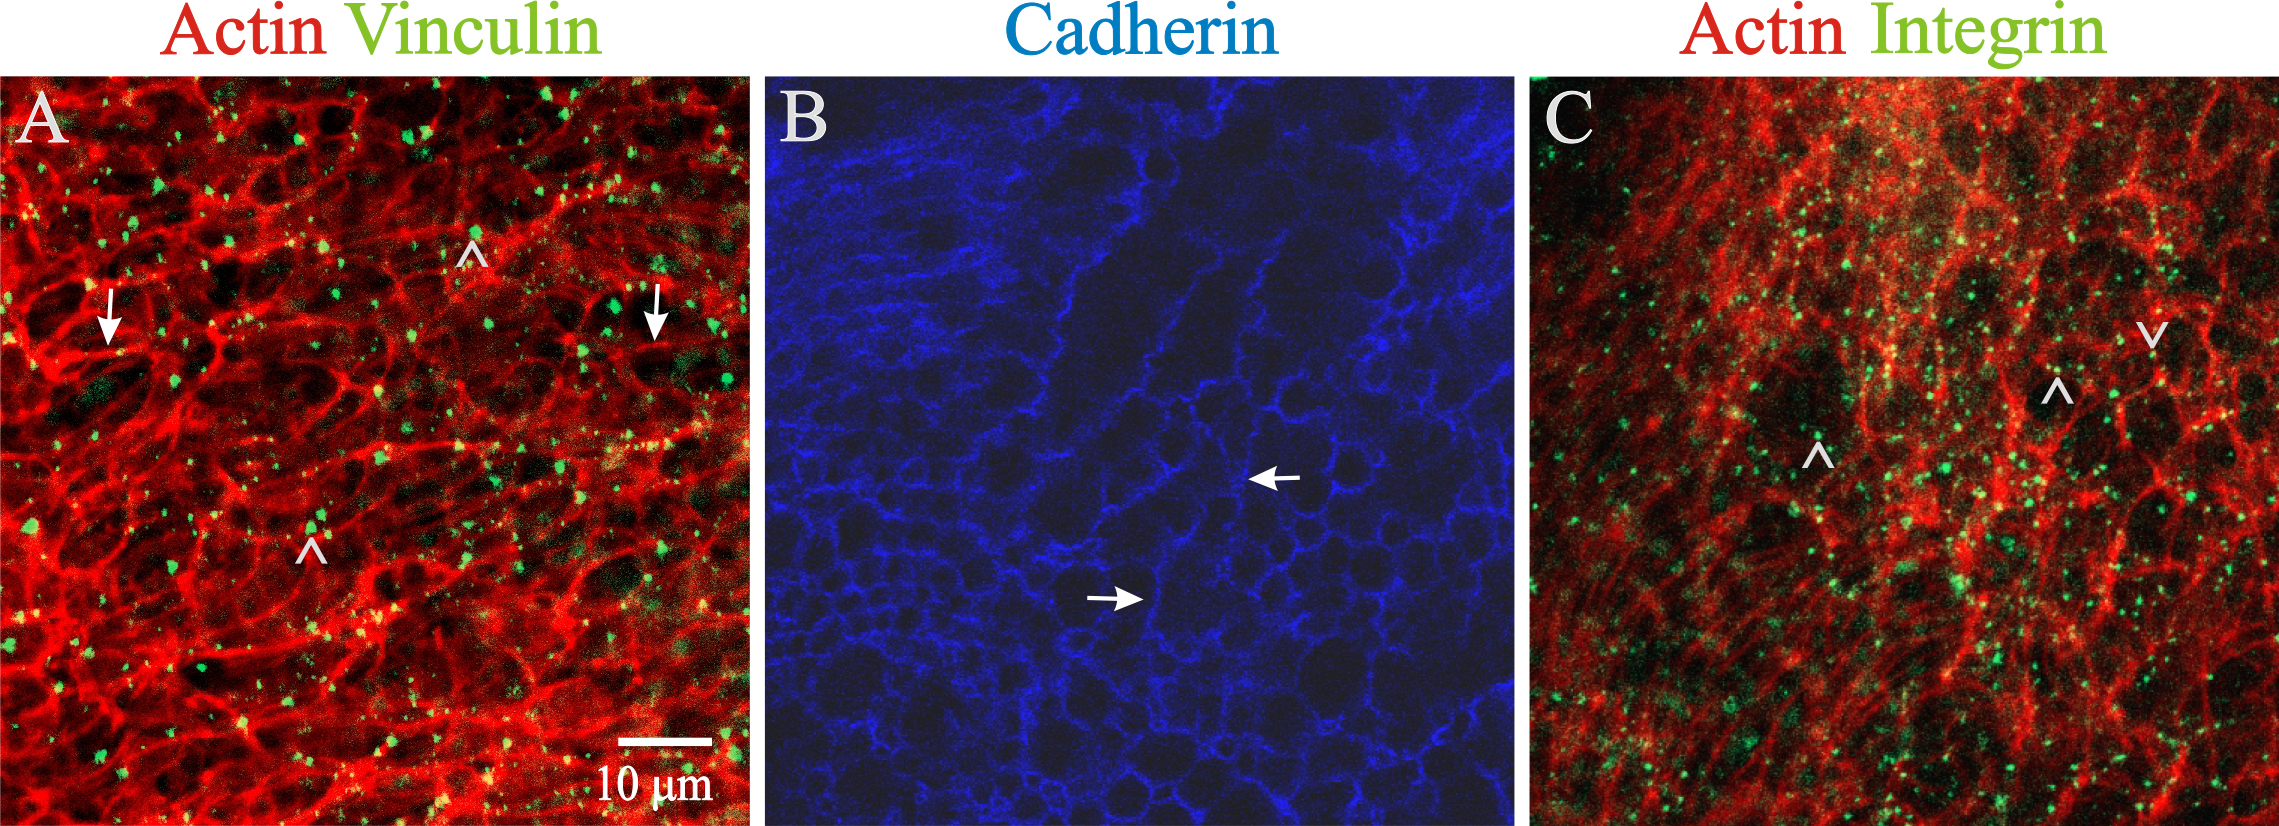
 Figure 4 of
Joy, Mol Vis 2014; 20:1777-1795.
Figure 4 of
Joy, Mol Vis 2014; 20:1777-1795.