Figure 2. LSCM images of 2–6-week-old RCS-rdy+/Lav (control) posterior fiber ends in the en face orientation. In control rat lenses the distribution of F-actin, vinculin,
cadherin and integrin did not alter as a function of age. A: A 2-week-old animal. Vinculin was present as discrete spots located at cell membranes (arrowheads) and was closely associated
with F-actin, which outlined the fiber ends (arrows). B: A 4-week-old animal. β integrin in the control animals was distributed as a plaque within fiber ends (asterisks). C: A 3-week-old animal. Immunofluorescence for cadherin was present at the BMC periphery. Panels A–C are at the same magnification. D: A 6-week-old animal. Double labeling for F-actin and cadherin demonstrated that both components were localized at the periphery
of the BMC and demonstrated a high degree of co-localization (arrows).
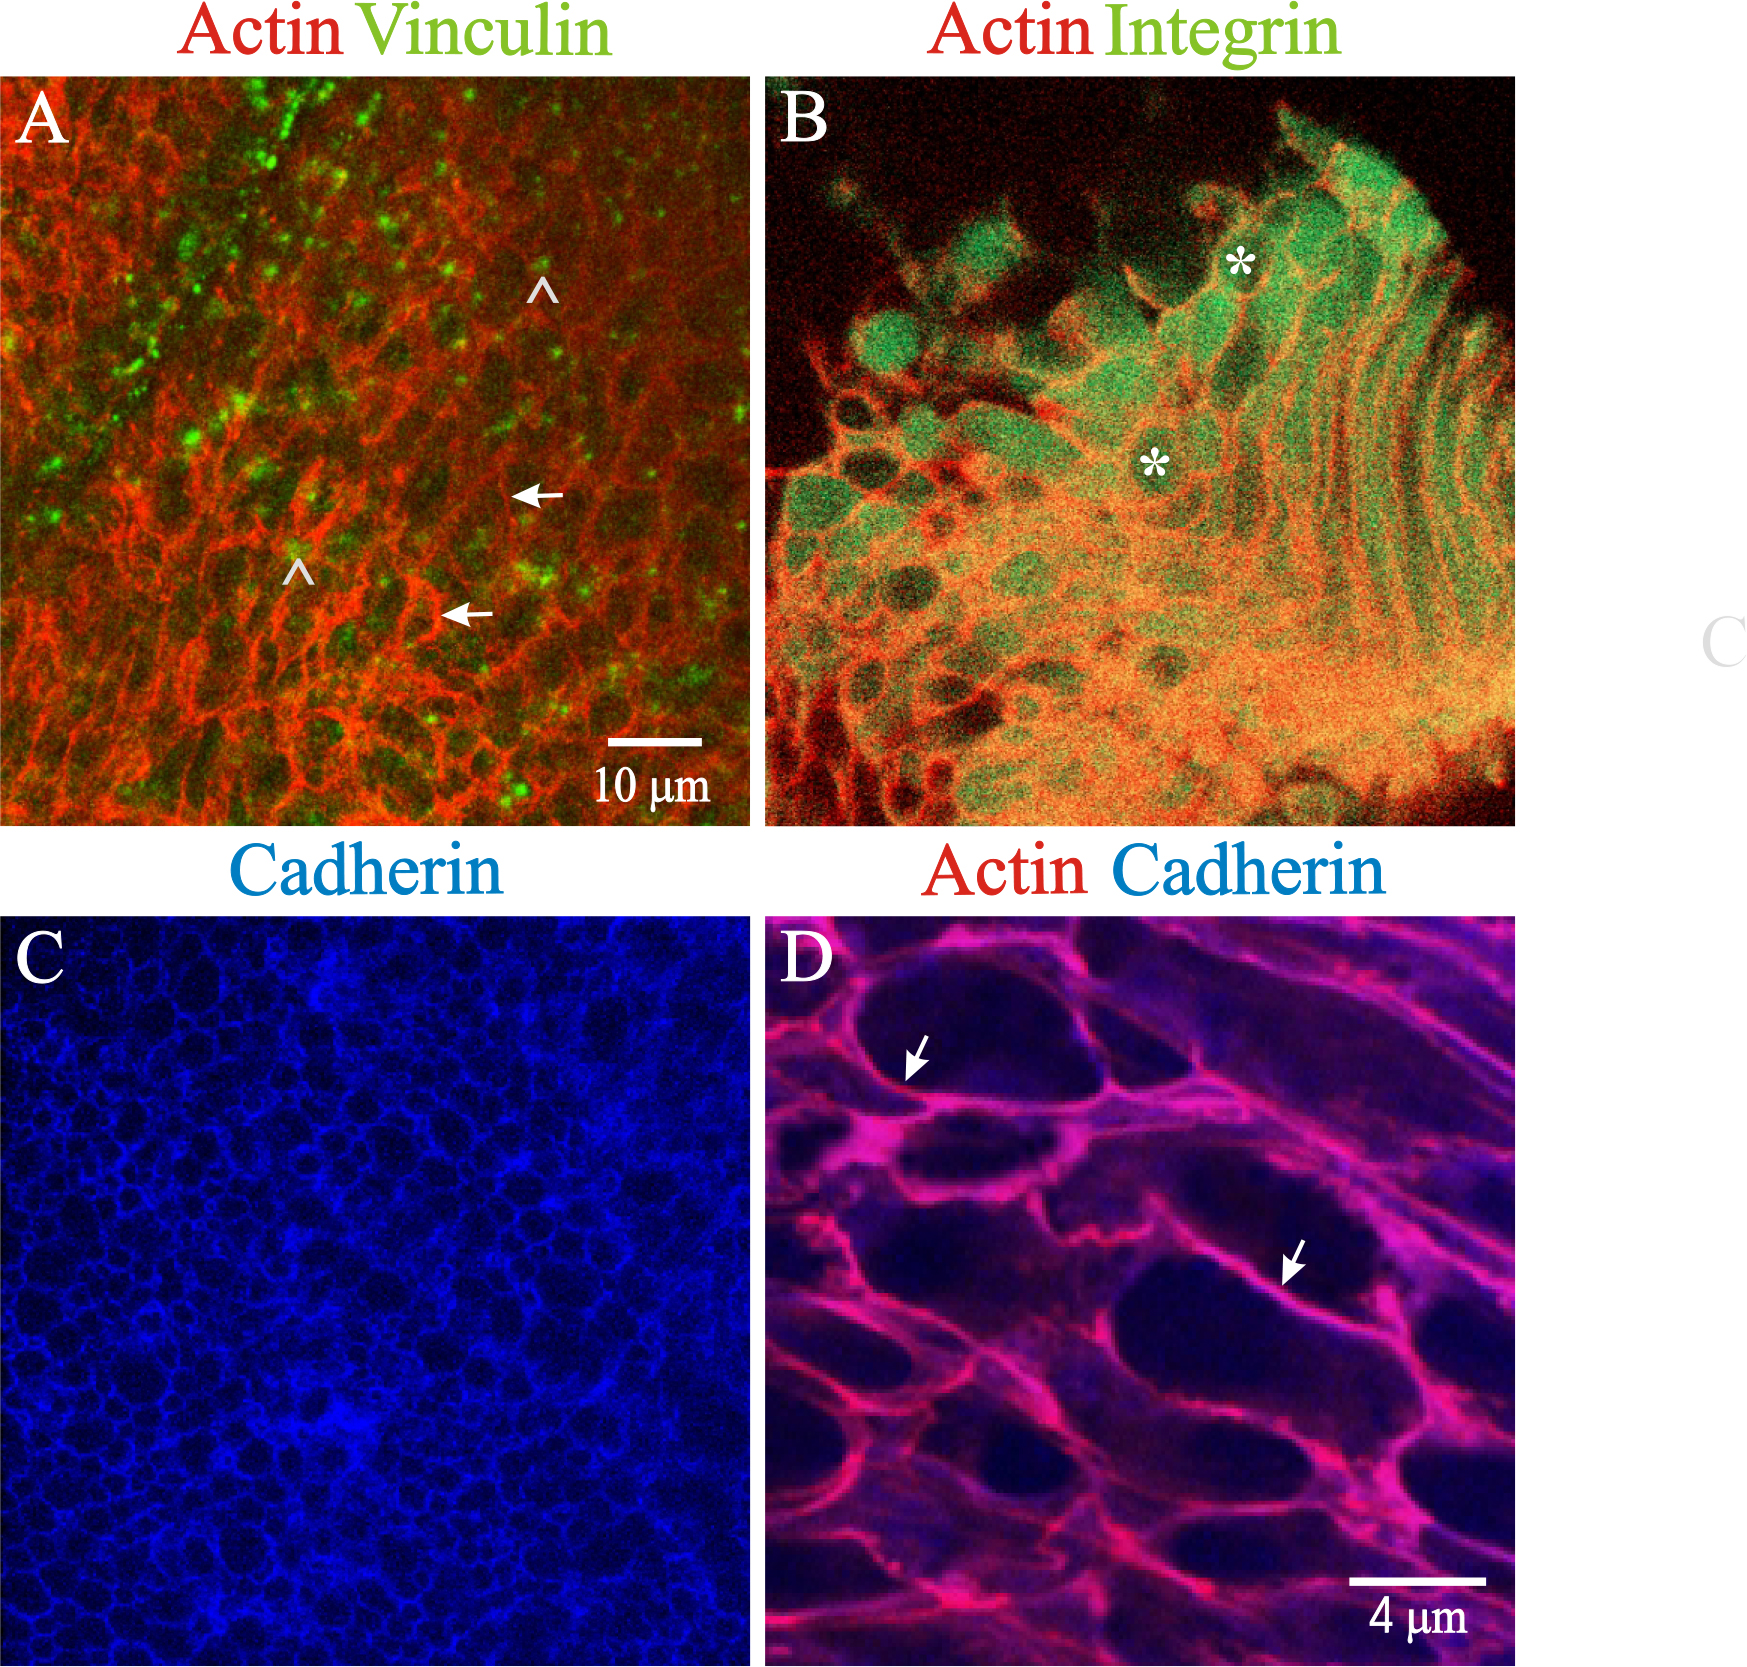
 Figure 2 of
Joy, Mol Vis 2014; 20:1777-1795.
Figure 2 of
Joy, Mol Vis 2014; 20:1777-1795.