Figure 10. Bar graphs showing the intravitreal concentration of pro-inflammatory cytokines in RCS control (n=24) and RCS dystrophic (n=48)
rat eyes over time. The data are plotted as mean ± standard error of the mean; * indicates significant difference between
control and dystrophic groups (p≤0.05). A: IL-1α, B: IL-4, C: IL-6, D: IL-8, E: TNF, F: IFN-γ.
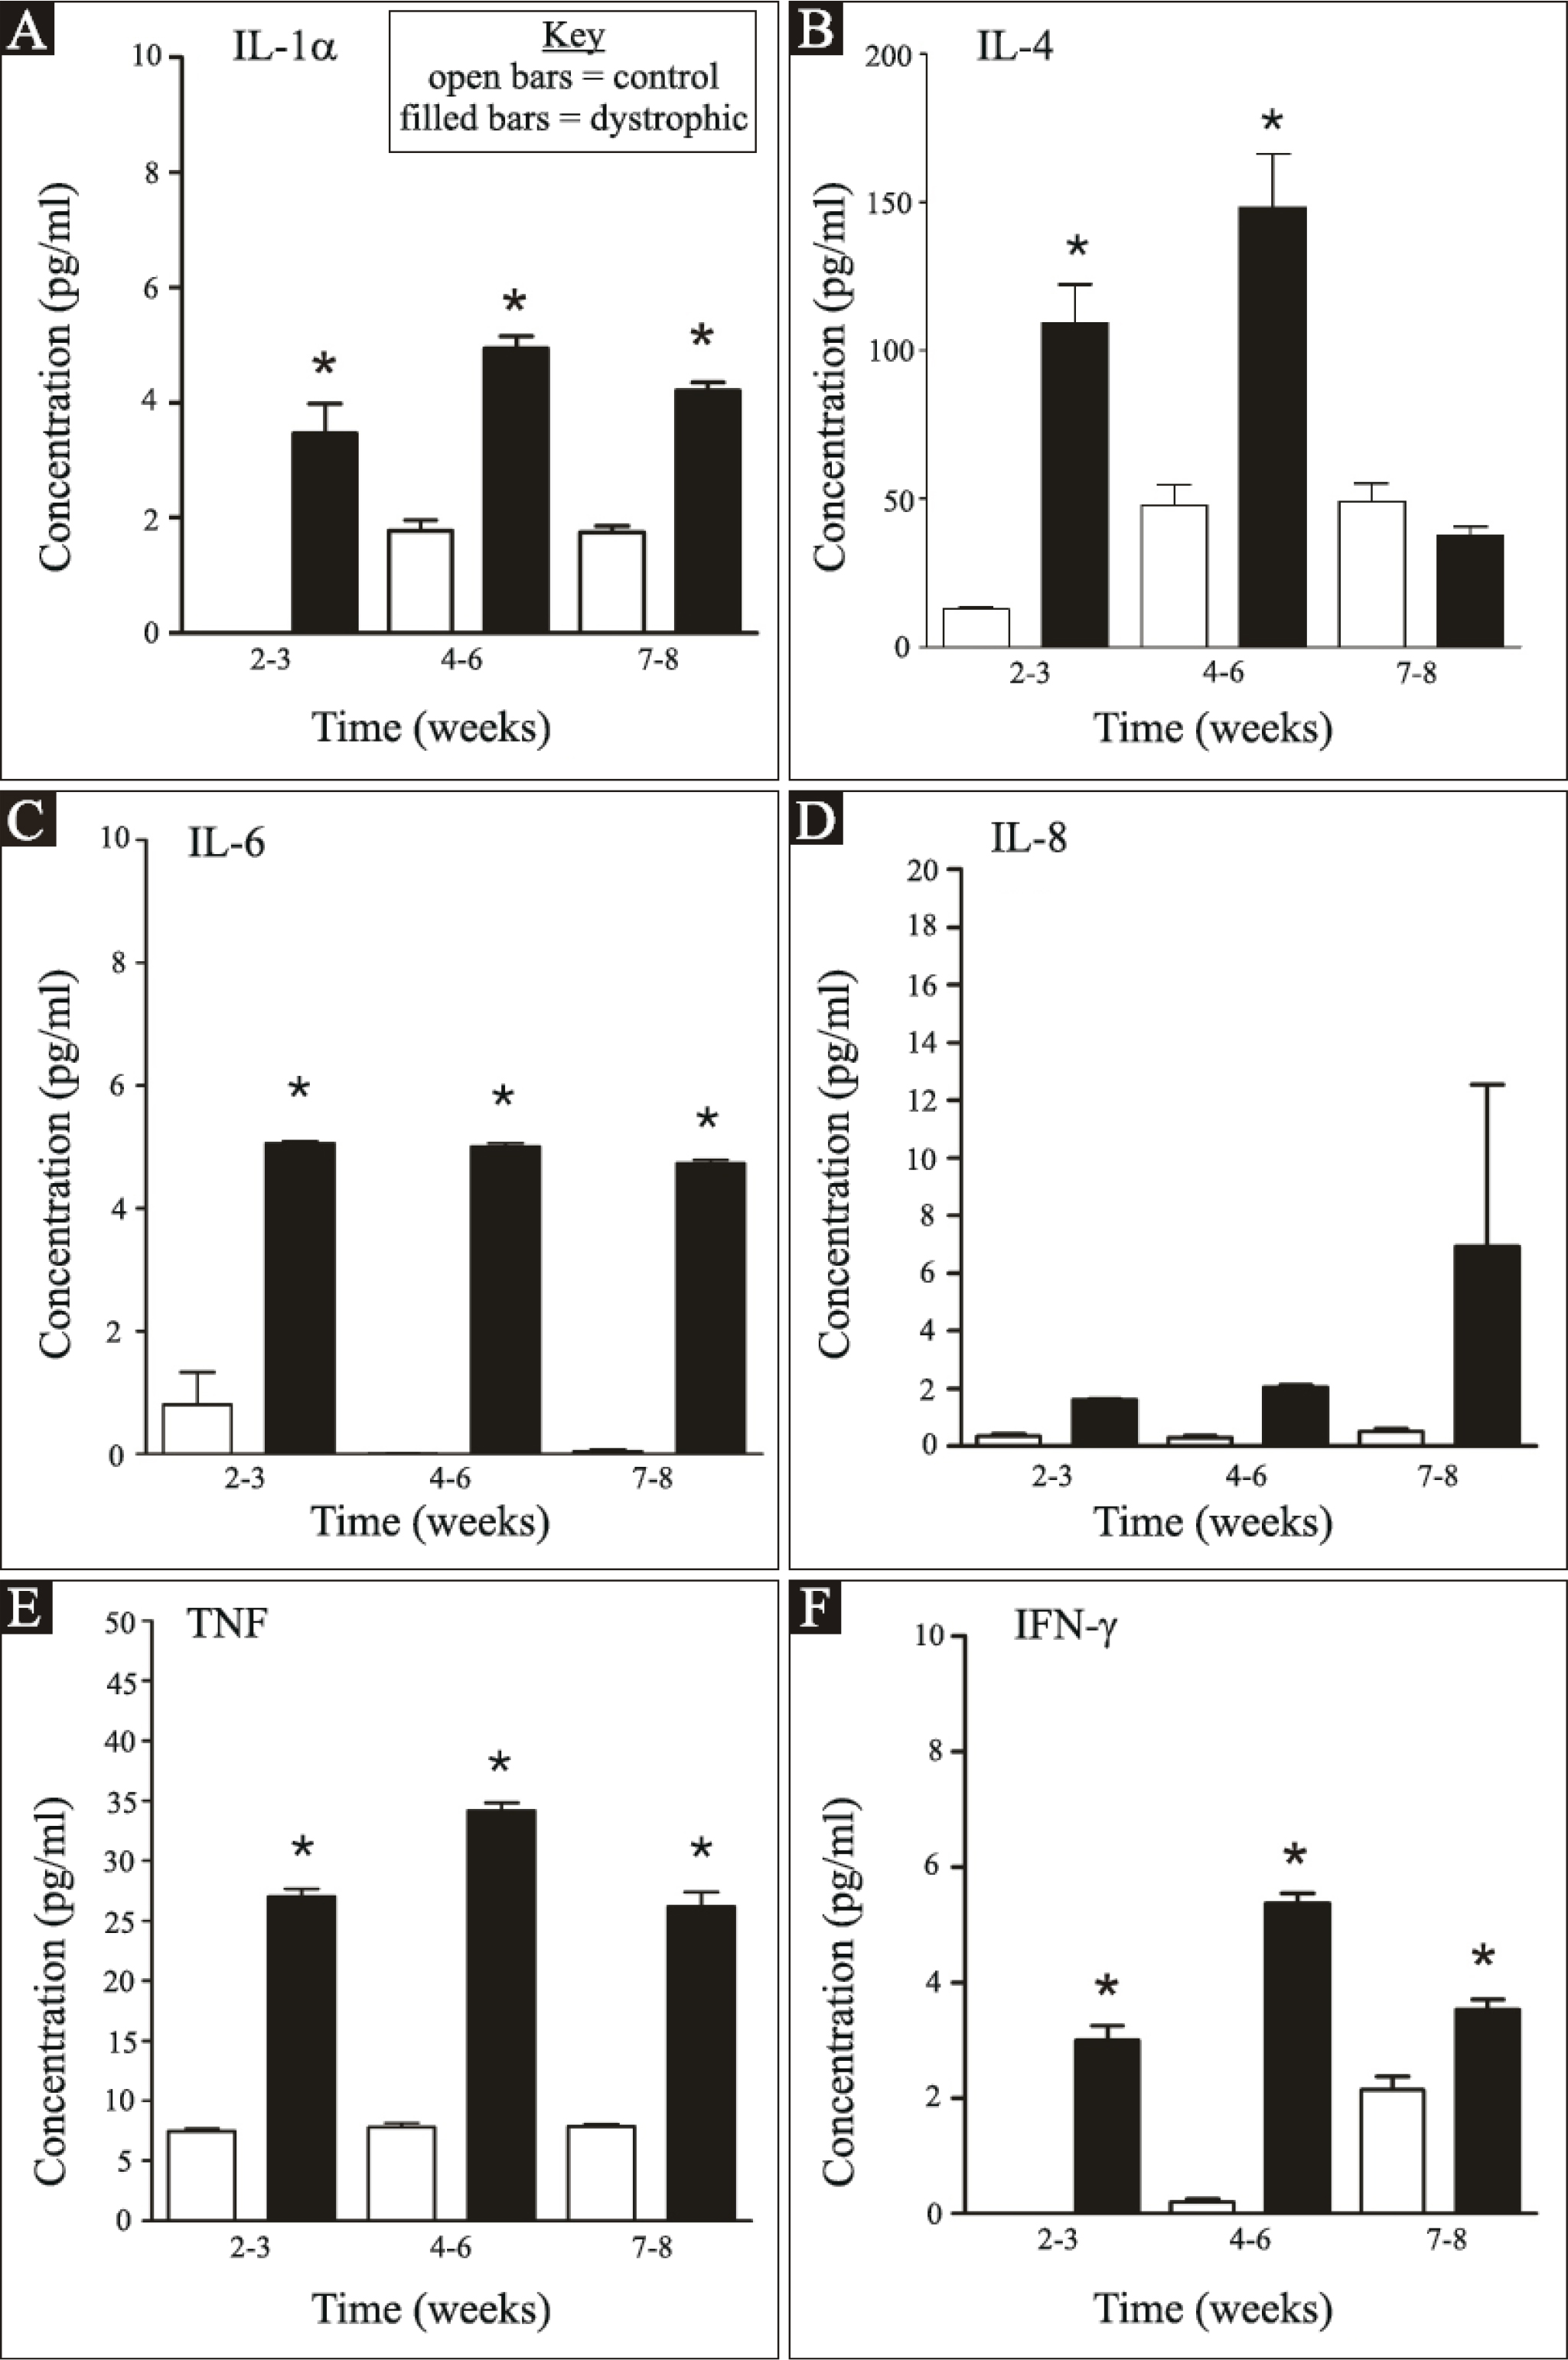
 Figure 10 of
Joy, Mol Vis 2014; 20:1777-1795.
Figure 10 of
Joy, Mol Vis 2014; 20:1777-1795.