Figure 9. Effect of XAV939 treatment on mitochondrial depolarization in HLE-B3 cells. [Top panel] Serial confocal imaging was used to determine the extent of mitochondrial depolarization in cells treated with XAV939. Sequential
images of the same random field of cells were taken every 150 s for a 60-min duration (Bar=20 µm). Confocal images indicated
that the cells treated with either 0.5 µm or 1 µm of XAV939 showed a marked increase in the green/red fluorescence ratio,
indicative of depolarization, as compared to control cells. [Bottom panel] Confocal images of the XAV939-treated cells indicated that there was a marked increase in green fluorescence intensity (indicative
of depolarization) at 0.5 μM, and to an even greater degree at 1 μM, as compared with the control cells.
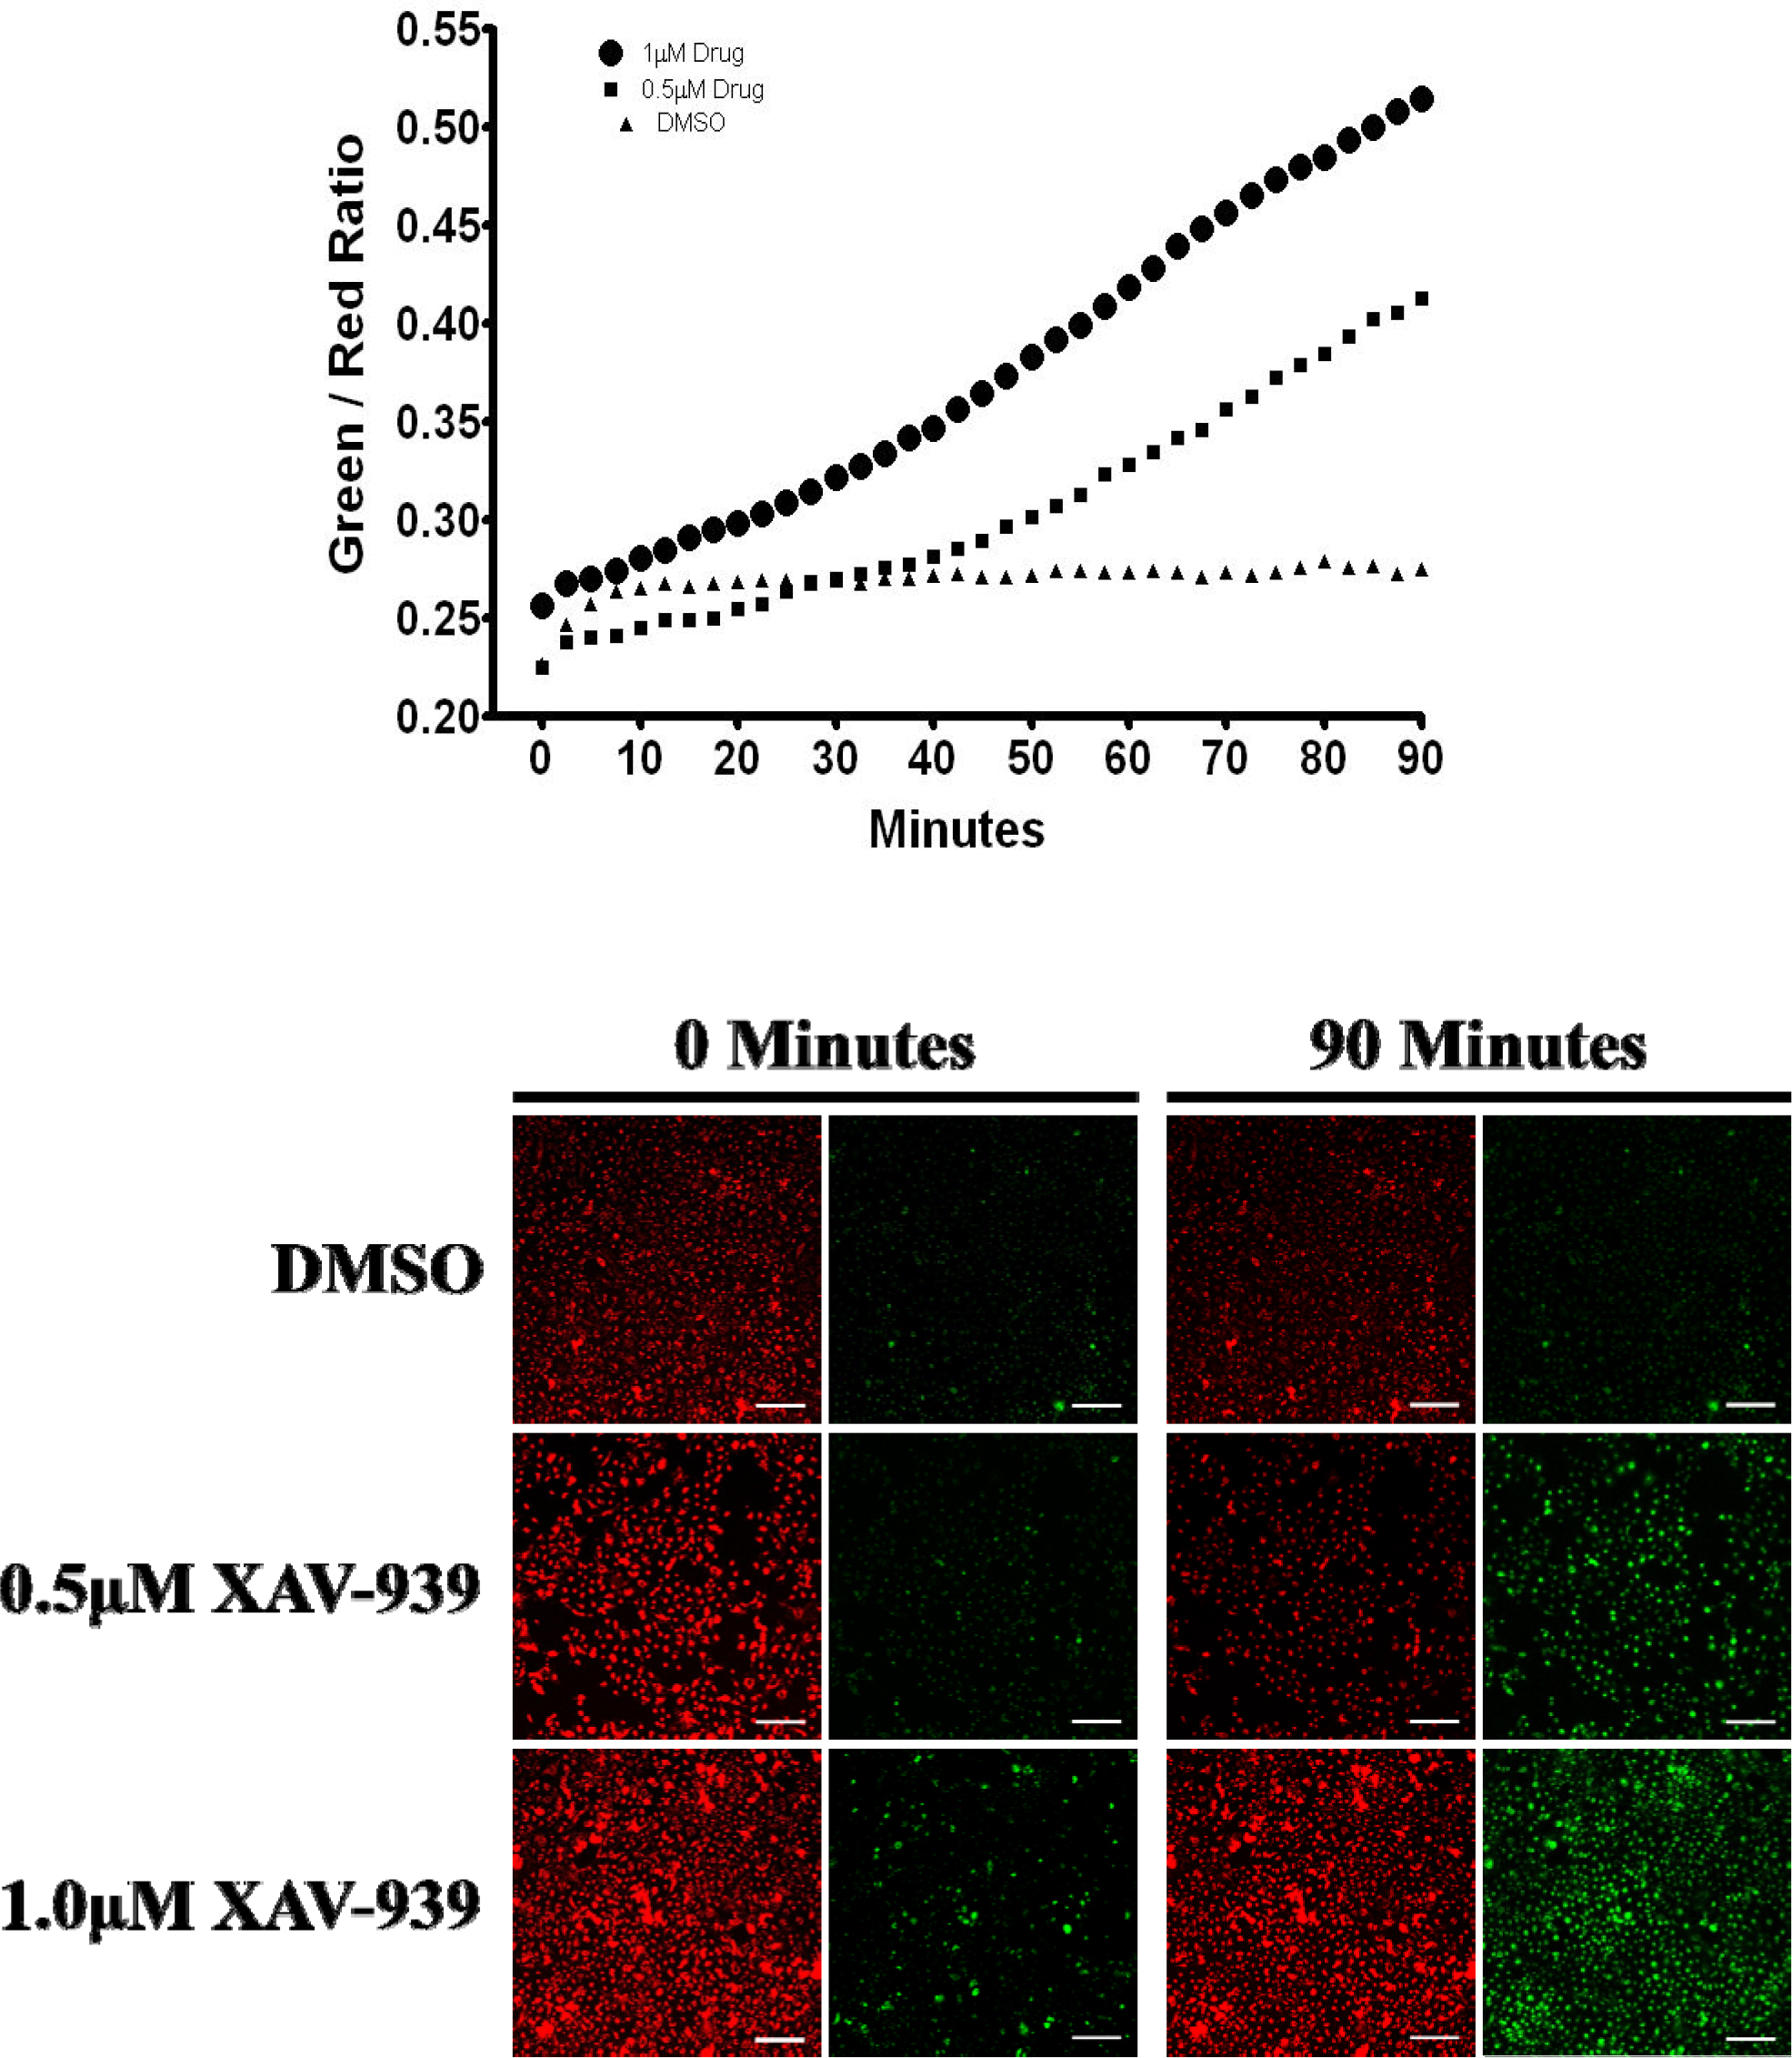
 Figure 9 of
Neelam, Mol Vis 2014; 20:1758-1775.
Figure 9 of
Neelam, Mol Vis 2014; 20:1758-1775.