Figure 5. Western blot analysis of alpha smooth muscle actin (α-SMA), fibronectin, and E-cadherin in HLE-B3 cells treated with SB216763.
[Top panel] The experiment was repeated three times using independent cell populations stemming from a single cell passage. The normalized
lysates were analyzed for levels of α-SMA and fibronectin using ImageJ analysis. There was a significant increase in the expression
of both α-SMA and fibronectin in the SB216763-treated samples as compared to the corresponding control samples treated with
DMSO (p<0.05). [Bottom panel] The normalized lysates were analyzed for levels of E-cadherin using ImageJ analysis. The experiment was repeated three times
using independent cell populations stemming from a single cell passage. There was a significant decrease in the expression
of E-cadherin in the SB216763-treated samples as compared to the corresponding control samples treated with DMSO (p<0.05).
SB=SB216763.
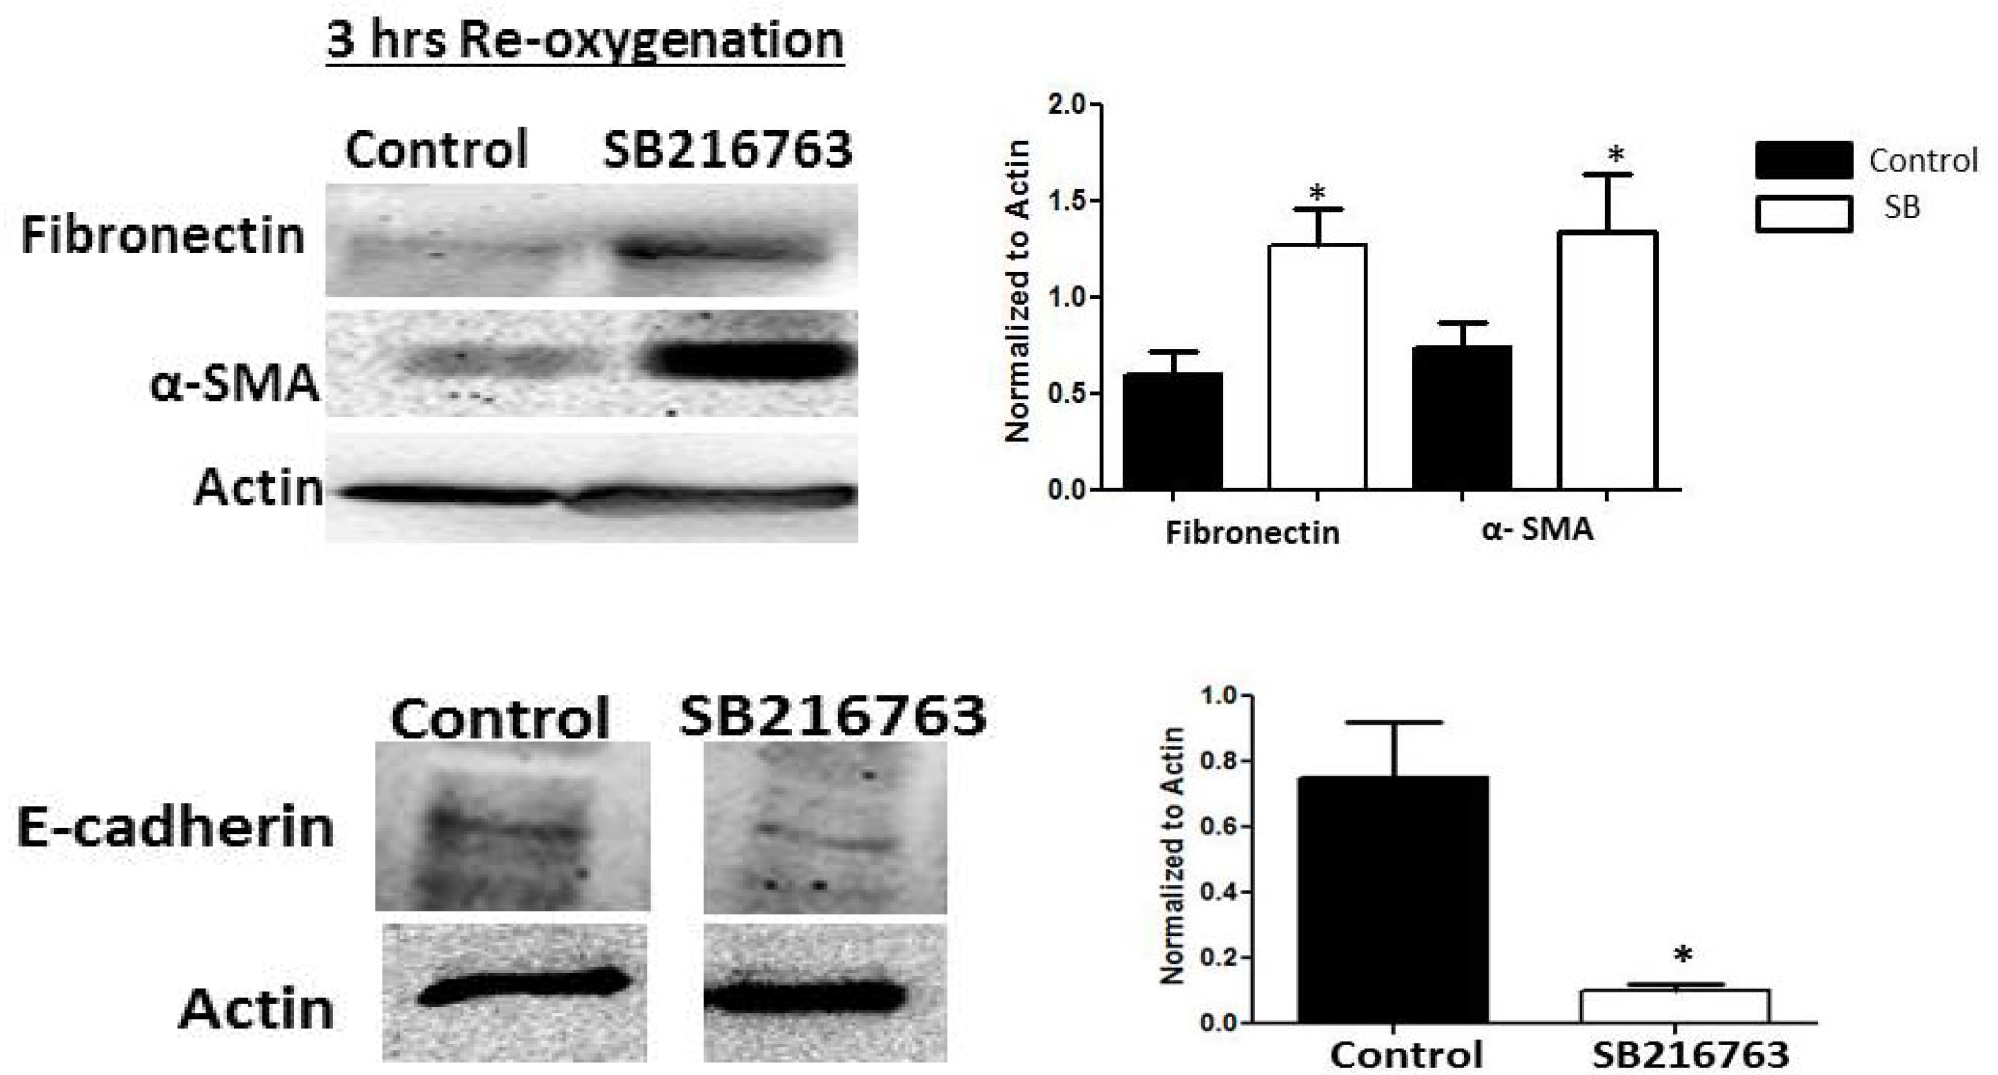
 Figure 5 of
Neelam, Mol Vis 2014; 20:1758-1775.
Figure 5 of
Neelam, Mol Vis 2014; 20:1758-1775.