Figure 3. Detection of VEGF levels in atmospheric oxygen by ELISA. A: The supernatants from the cells incubated in hypoxia and later switched to atmospheric oxygen were compared with the supernatants
collected from cells in consistent atmospheric oxygen for VEGF levels by ELISA. Samples were derived from three independent
cell populations. A student’s t test was performed and significantly higher levels of VEGF were detected in cells switched from hypoxia to atmospheric oxygen
as compared to cells maintained consistently in atmospheric oxygen (p<0.05). B: Detection of VEGF levels in cells treated with SB216763. The cells were incubated in triplicate from a single cell population
with 3 ml of serum-free media containing 12 µm of SB216763 for 3 h in hypoxia. The asterisk (*) indicates a statistically
significant (p<0.05) increase in the VEGF levels at 24 h in the SB216763-treated cells as compared to the control cells. SB=SB216763.
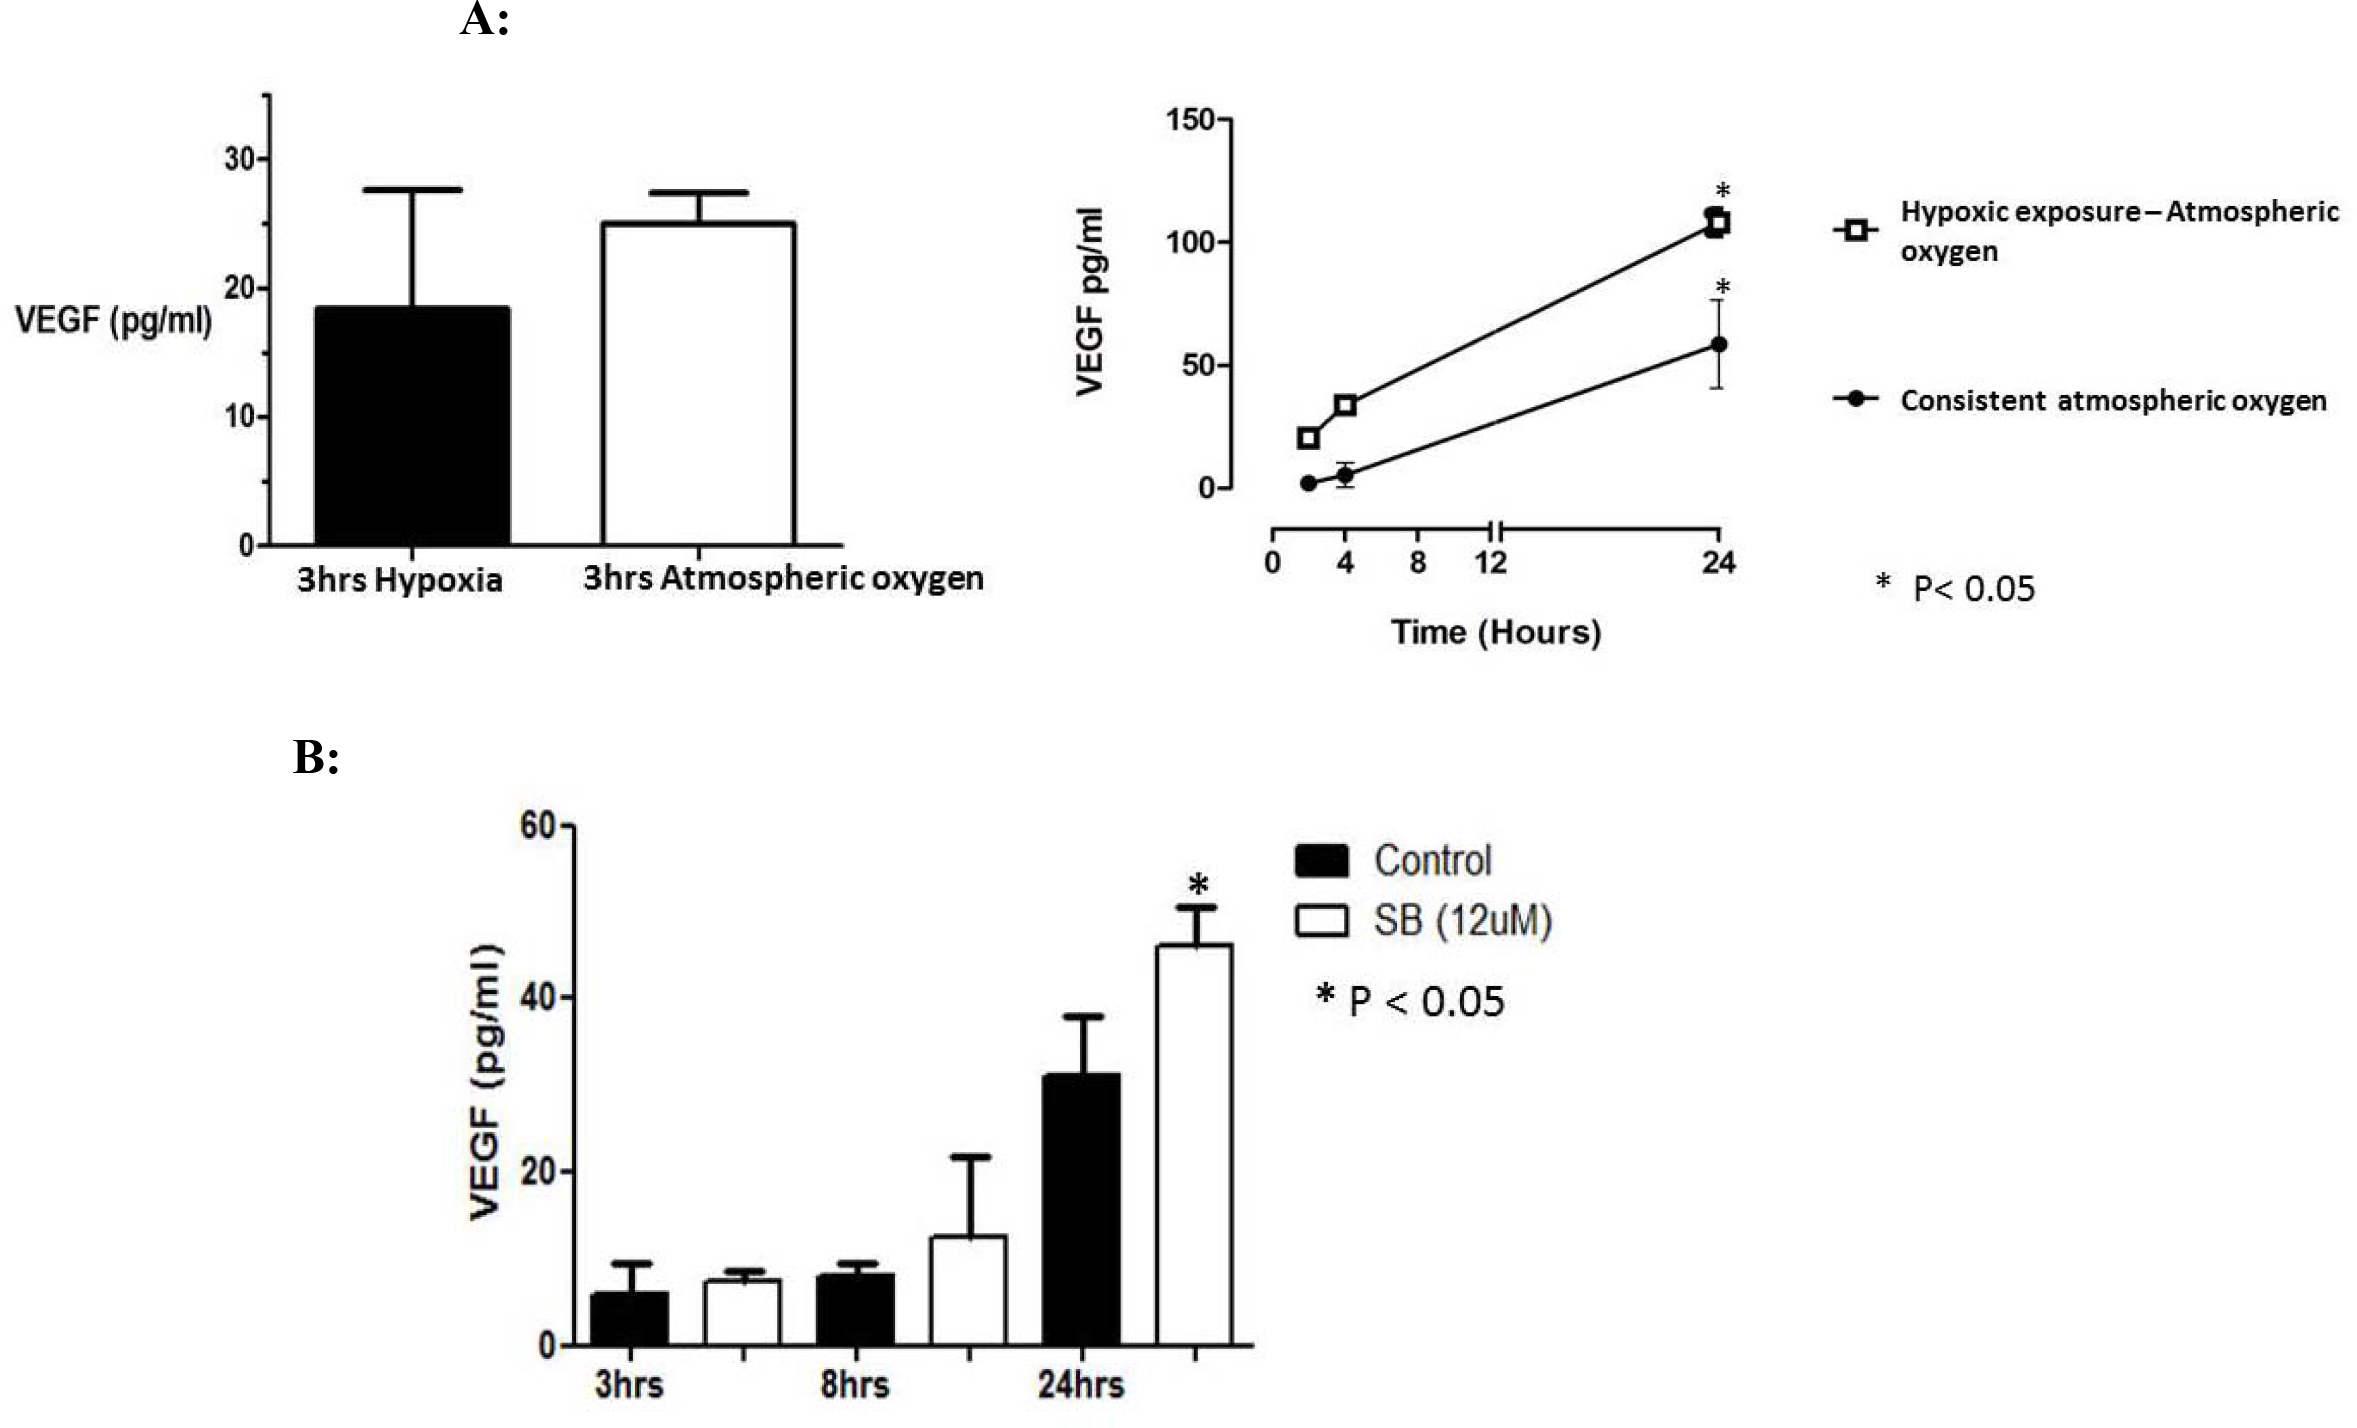
 Figure 3 of
Neelam, Mol Vis 2014; 20:1758-1775.
Figure 3 of
Neelam, Mol Vis 2014; 20:1758-1775.