Figure 2. Western blot analysis of β-catenin and phospho-β-catenin in HLE-B3 cells treated with SB216763. The experiment was repeated
three times with independent cell populations, and the ratio between β-catenin and phospho-β-catenin was quantified using
ImageJ analysis. The levels of β-catenin and phospho-β-catenin in the cytoplasmic extracts were unchanged, whereas in the
nuclear extracts there was a significant increase in β-catenin and decrease in phospho-β-catenin in the SB216763-treated cells
as compared with the controls. The asterisk (*) indicates a significant increase in nuclear β-catenin (p<0.05). There was
no significant carryover of the cytoplasmic markers in the nuclear fractions. SB=SB216763.
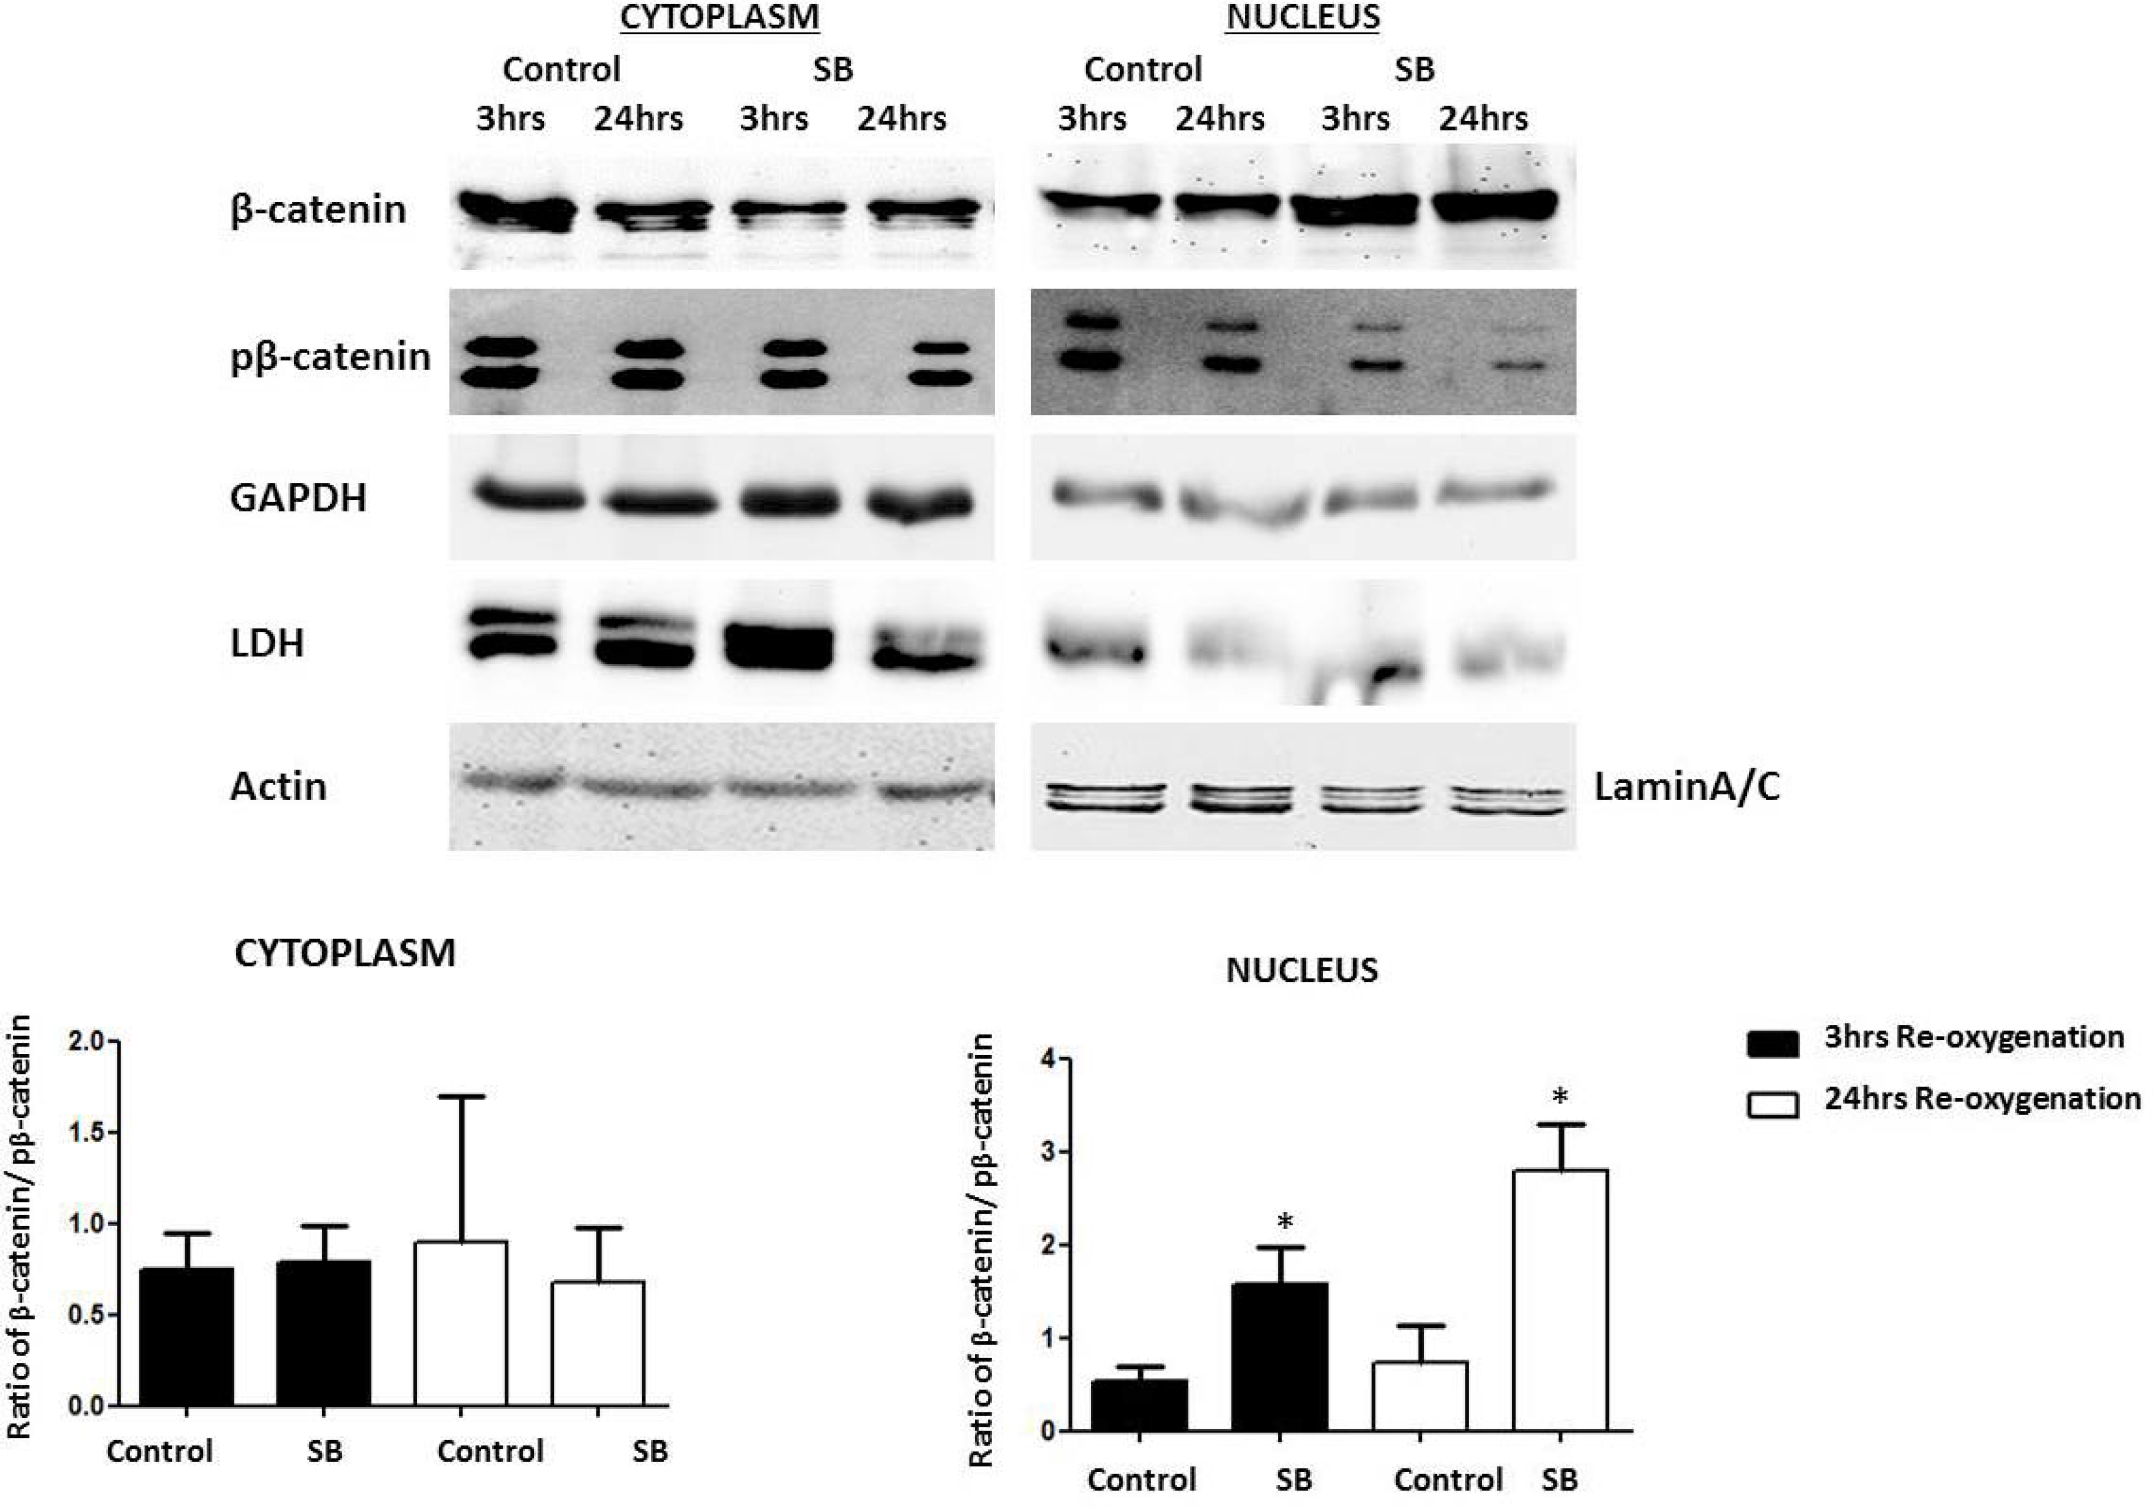
 Figure 2 of
Neelam, Mol Vis 2014; 20:1758-1775.
Figure 2 of
Neelam, Mol Vis 2014; 20:1758-1775.