Figure 3. Chromatograms showing eight mutations identified in the CNGB3 gene in patients with ACHM. A: Sequence trace of part of intron 13 in an affected individual p1 carrying a heterozygous mutation c.1578+1G>A (upper panel)
and a normal control individual (lower panel). B: Part of intron 13 in an affected individual p1 carrying a heterozygous mutation c.1579–1G>A (upper panel) and a normal control
individual (lower panel). C: Part of exon 6 in an affected individual p2 carrying a heterozygous mutation c. 819_826del (upper panel) and a normal control
individual (lower panel). D: Part of exon 11 in an affected individual p2 carrying a heterozygous mutation c.1194T>G (upper panel) and a normal control
individual (lower panel). E: Part of exon 4 in an affected individual p3 carrying a heterozygous mutation c.393_394delGCinsTCCTGGTGA (upper panel) and
a normal control individual (lower panel). F: Part of intron 4 in an affected individual p3 carrying a heterozygous mutation c.494–2A>T (upper panel) and a normal control
individual (lower panel). G: Part of exon 10 in an affected individual p4 carrying a heterozygous mutation c.1148delC (upper panel) and a normal control
individual (lower panel). H: Part of exon 12 in an affected individual p4 carrying a heterozygous mutation c.1366delC (upper panel) and a normal control
individual (lower panel).
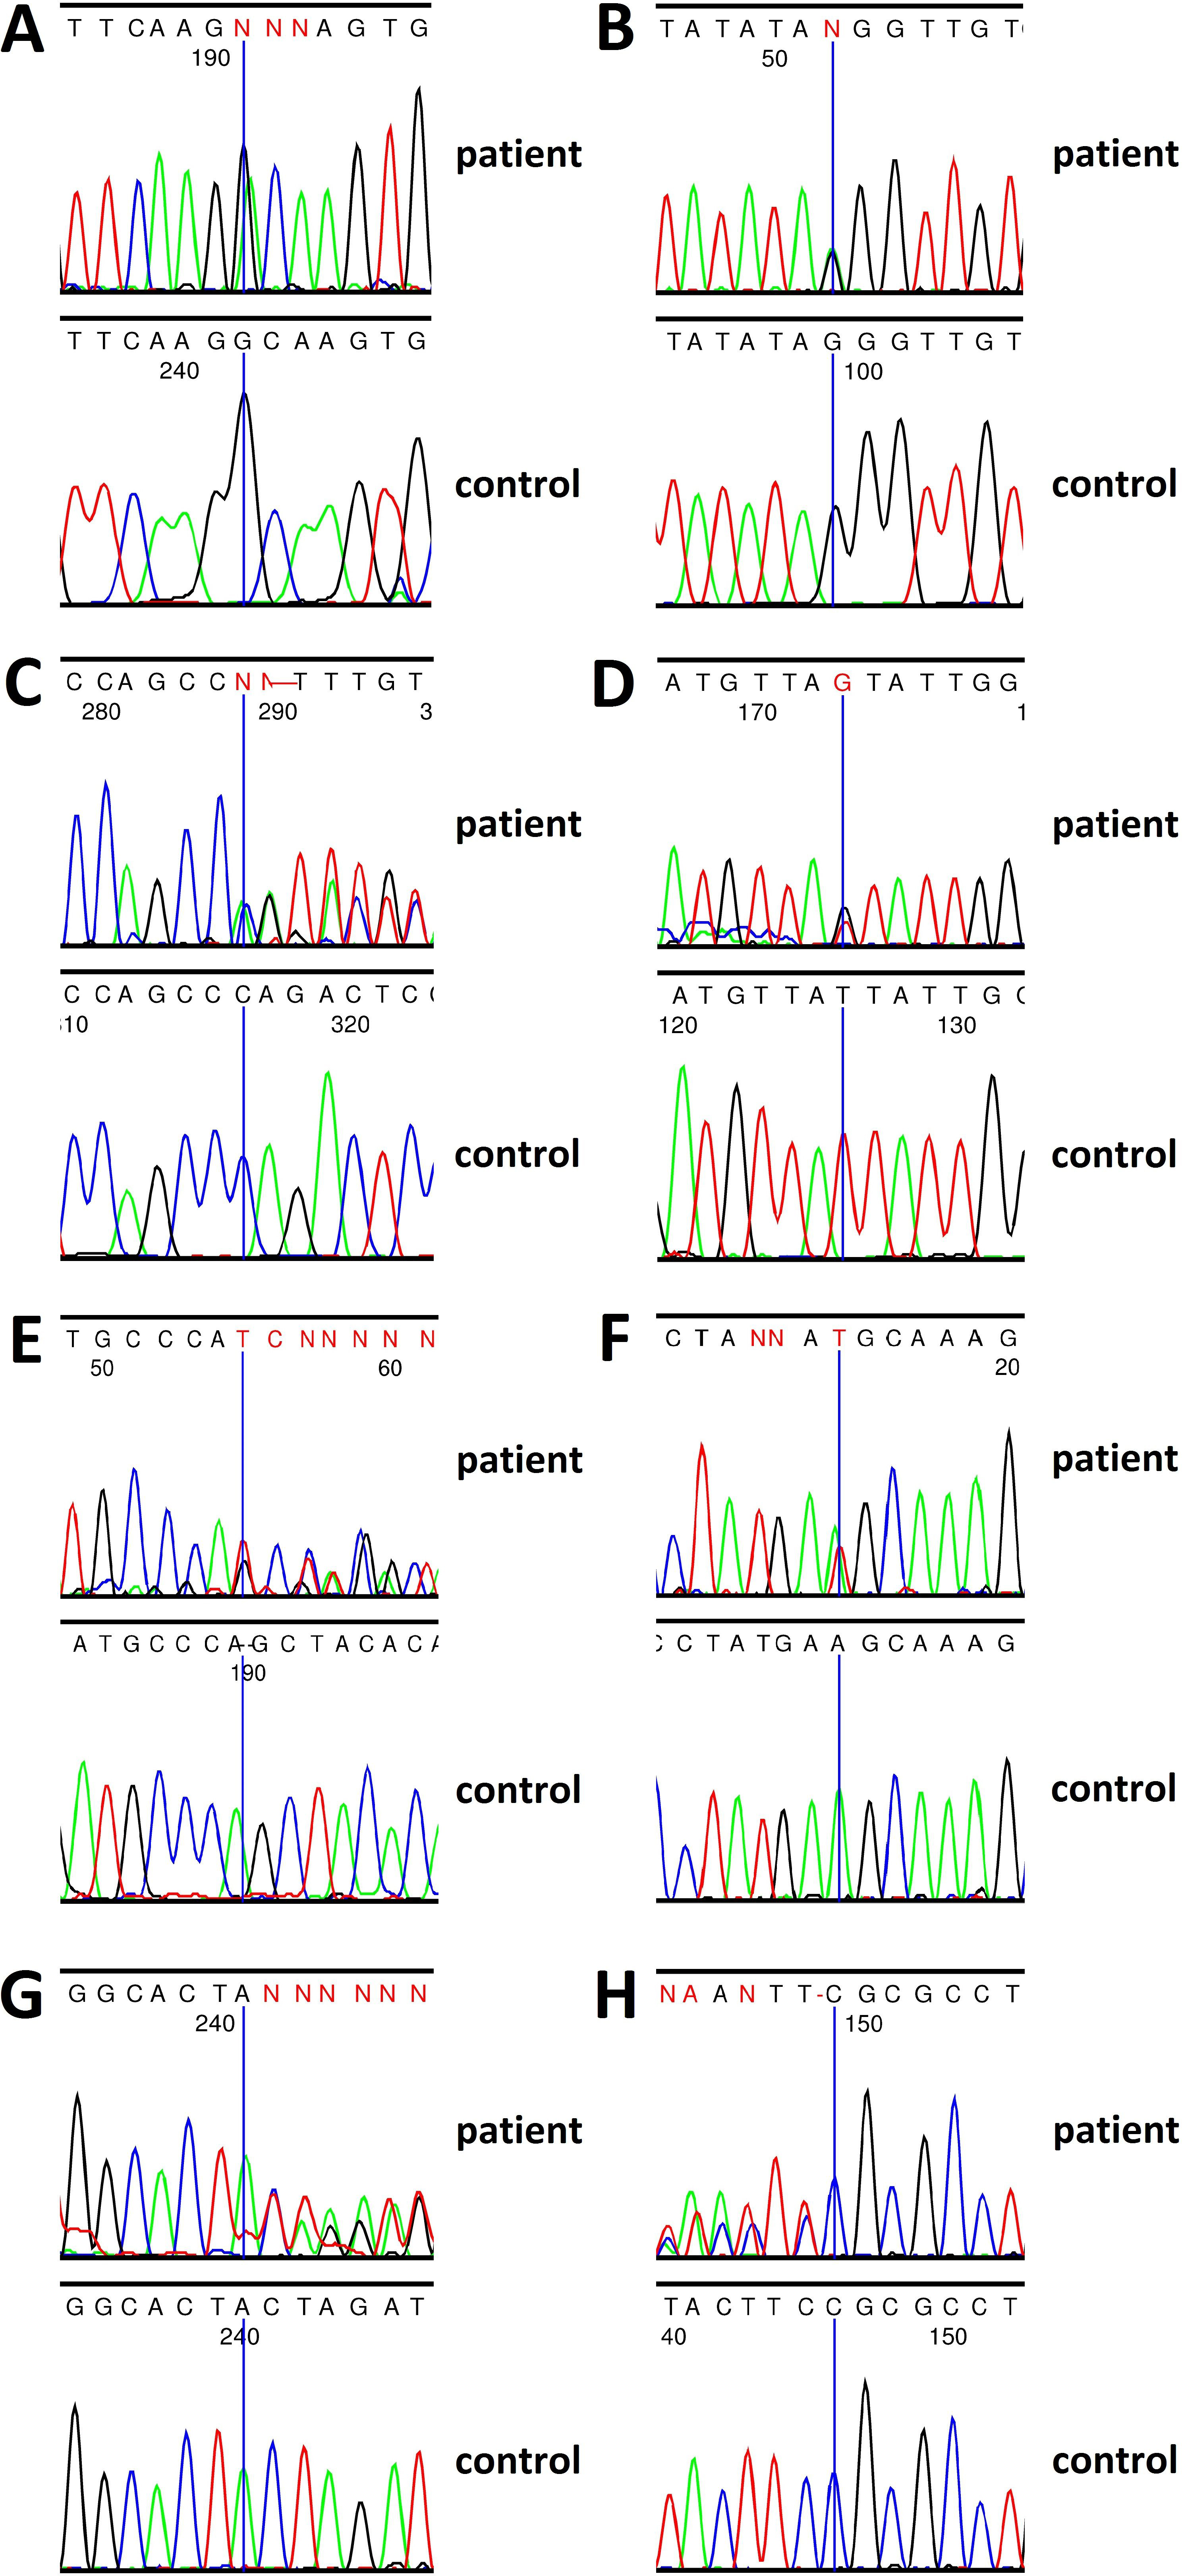
 Figure 3 of
Wawrocka, Mol Vis 2014; 20:1732-1739.
Figure 3 of
Wawrocka, Mol Vis 2014; 20:1732-1739.