Figure 2. ERG of p2. A: Photopic white flash electroretinogram (ERG) shows non-recordable response. B: Scotopic white flash ERG shows normal response. C: Photopic white 30 Hz flicker shows flat response. 1-L indicates the left eye; 2-R indicates the right eye.
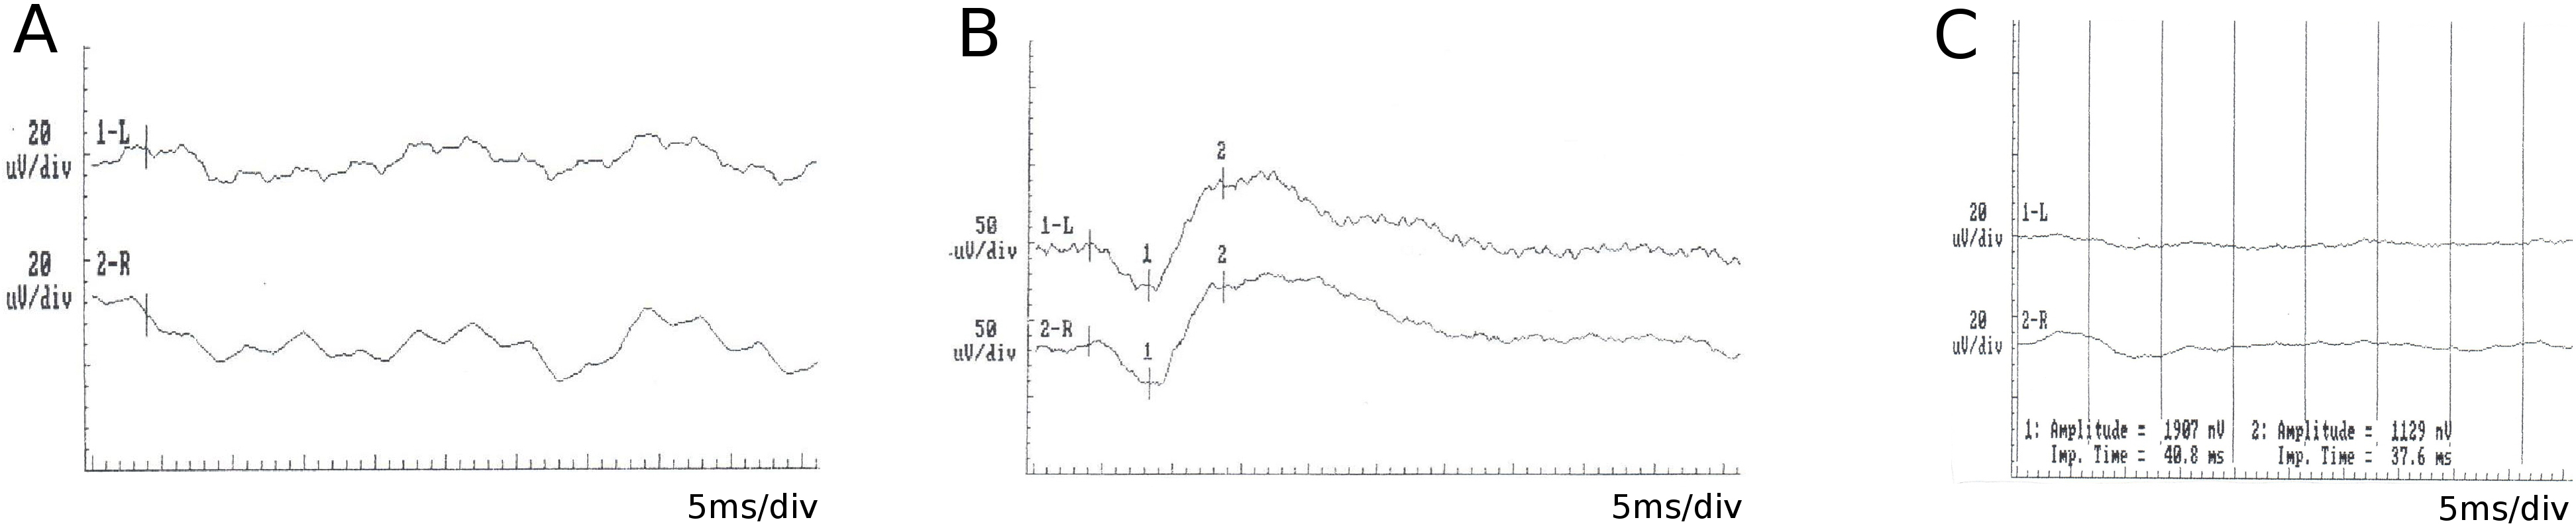
 Figure 2 of
Wawrocka, Mol Vis 2014; 20:1732-1739.
Figure 2 of
Wawrocka, Mol Vis 2014; 20:1732-1739.