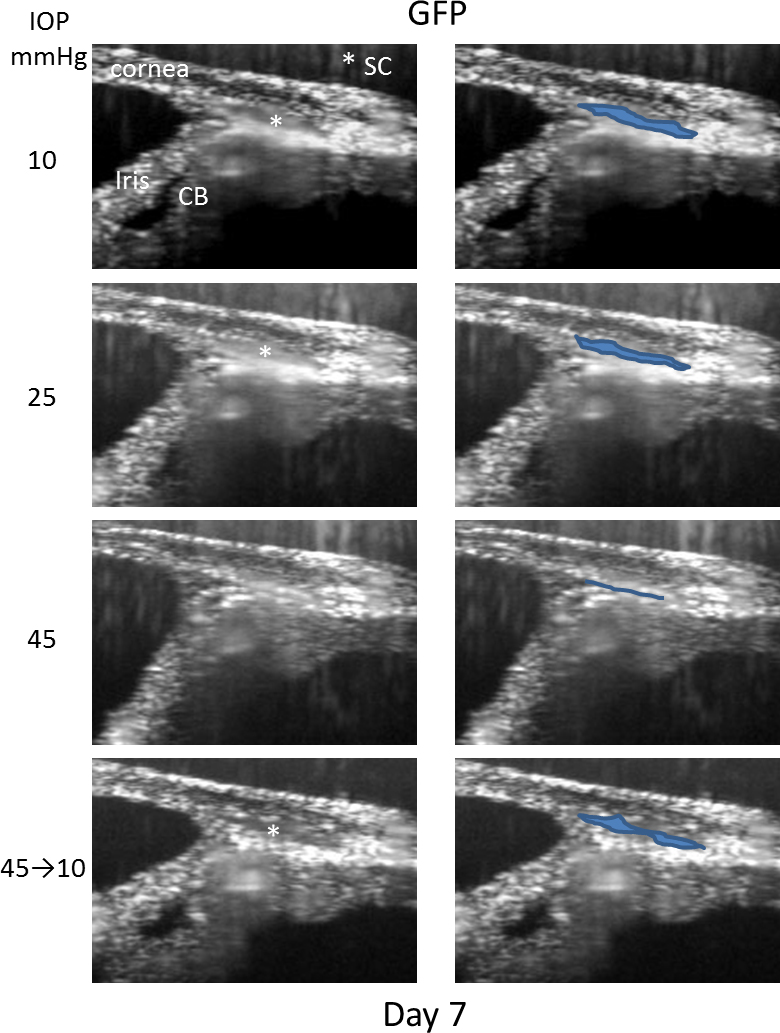
Figure 7. Example of SC lumen segmentation derived from OCT images of mouse eyes subjected to changes in IOP. In the left column are
the average intensity images of the same region of a mouse anterior eye held sequentially at 10, 25, 45, and 10 mmHg. In the
right column, the images are reproduced, and the SC lumen is outlined and highlighted. Asterisk shows the location of the
SC lumen. CB=ciliary body. Images shown were obtained from one mouse out of a total of three control mice that were segmented.

 Figure 7 of
Li, Mol Vis 2014; 20:1695-1709.
  Figure 7 of
Li, Mol Vis 2014; 20:1695-1709.