Figure 6. OCT imaging of conventional outflow tissues overexpressing BMP2 or GFP challenged with IOP gradients. After Ad.cmv.BMP2 or
Ad.cmv.GFP infusion into one eye, the anesthetized mice were secured in a custom imaging platform. Eyes were cannulated with
a glass needle to control and monitor intraocular pressure (IOP). The optical coherence tomography (OCT) probe was focused
on an open Schlemm’s canal (SC, asterisks), and images were captured at sequential IOPs of 10, 15, 20, 25, 30, 35, 45, and
finally back to 10 mmHg. A: The averaged intensity images of the BMP2 mouse eyes subjected to four of these pressure steps over time compared to the
control. Data shown were taken from different mice at each time point (representing a total of 12 that were imaged). CB=ciliary
body. B: Quantitative analysis of Schlemm’s canal lumen area in OCT images at sequential changes in cannulation-induced intraocular
pressure. ImageJ software was used to analyze the OCT images captured from mice that were subjected to sequential changes
in IOP as displayed in panel A. Data are normalized to the initial IOP of 10 mmHg to facilitate comparisons between animals, which had initial SC lumen
dimensions that varied. Data represent mean ± SD, *p<0.05 comparing green fluorescent protein (GFP) and BMP2 eyes at 7, 10,
and 36 days after viral infusion. All data are from mice with open iridocorneal angles, except BMP2 mice at 36 days, which
had closed angles for comparisons.
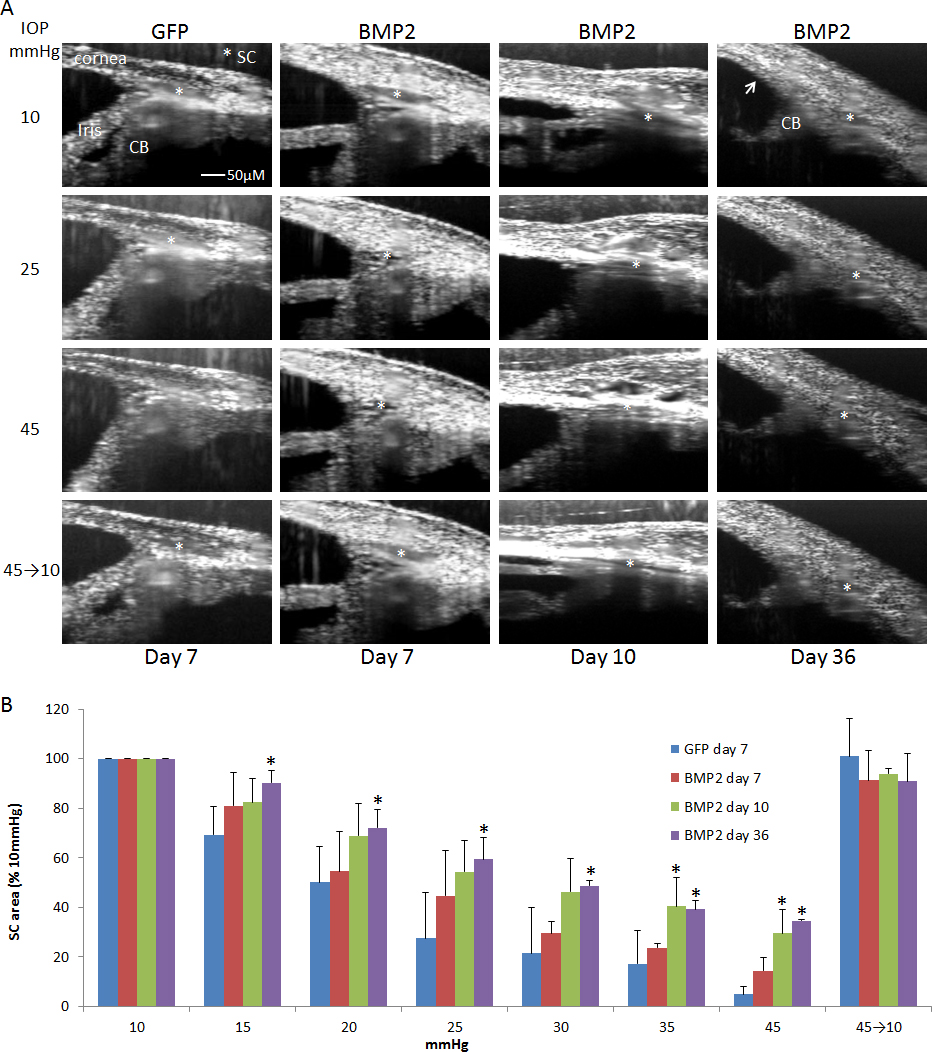
 Figure 6 of
Li, Mol Vis 2014; 20:1695-1709.
Figure 6 of
Li, Mol Vis 2014; 20:1695-1709.