Figure 5. Monitoring disease progression of murine conventional outflow tissues overexpressing BMP2 using OCT. Shown are averaged intensity
optimal coherence tomography (OCT) images of anterior angle tissues in the sagittal orientation 7, 10, 23, 36, or 90 days
after infusion of adenovirus-encoding BMP2 or naive contralateral control (CON). All eyes were cannulated and held at 10 mmHg
during the imaging sessions. A total of 14 mice were used in these experiments; representative data from one mouse (of three
total) at each time point are shown. The exception is that only two mice were imaged at 90 days. Asterisk indicates the location
of Schlemm’s canal lumen; red brackets indicate peripheral corneal thickness; CB=ciliary body. The arrow shows iris synechiae
(closed angle).
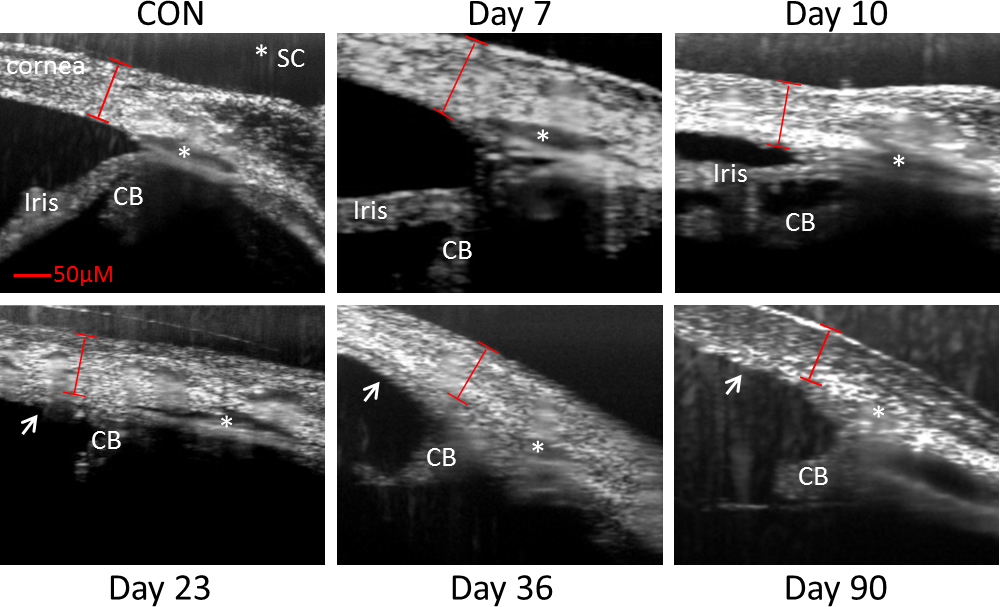
 Figure 5 of
Li, Mol Vis 2014; 20:1695-1709.
Figure 5 of
Li, Mol Vis 2014; 20:1695-1709.