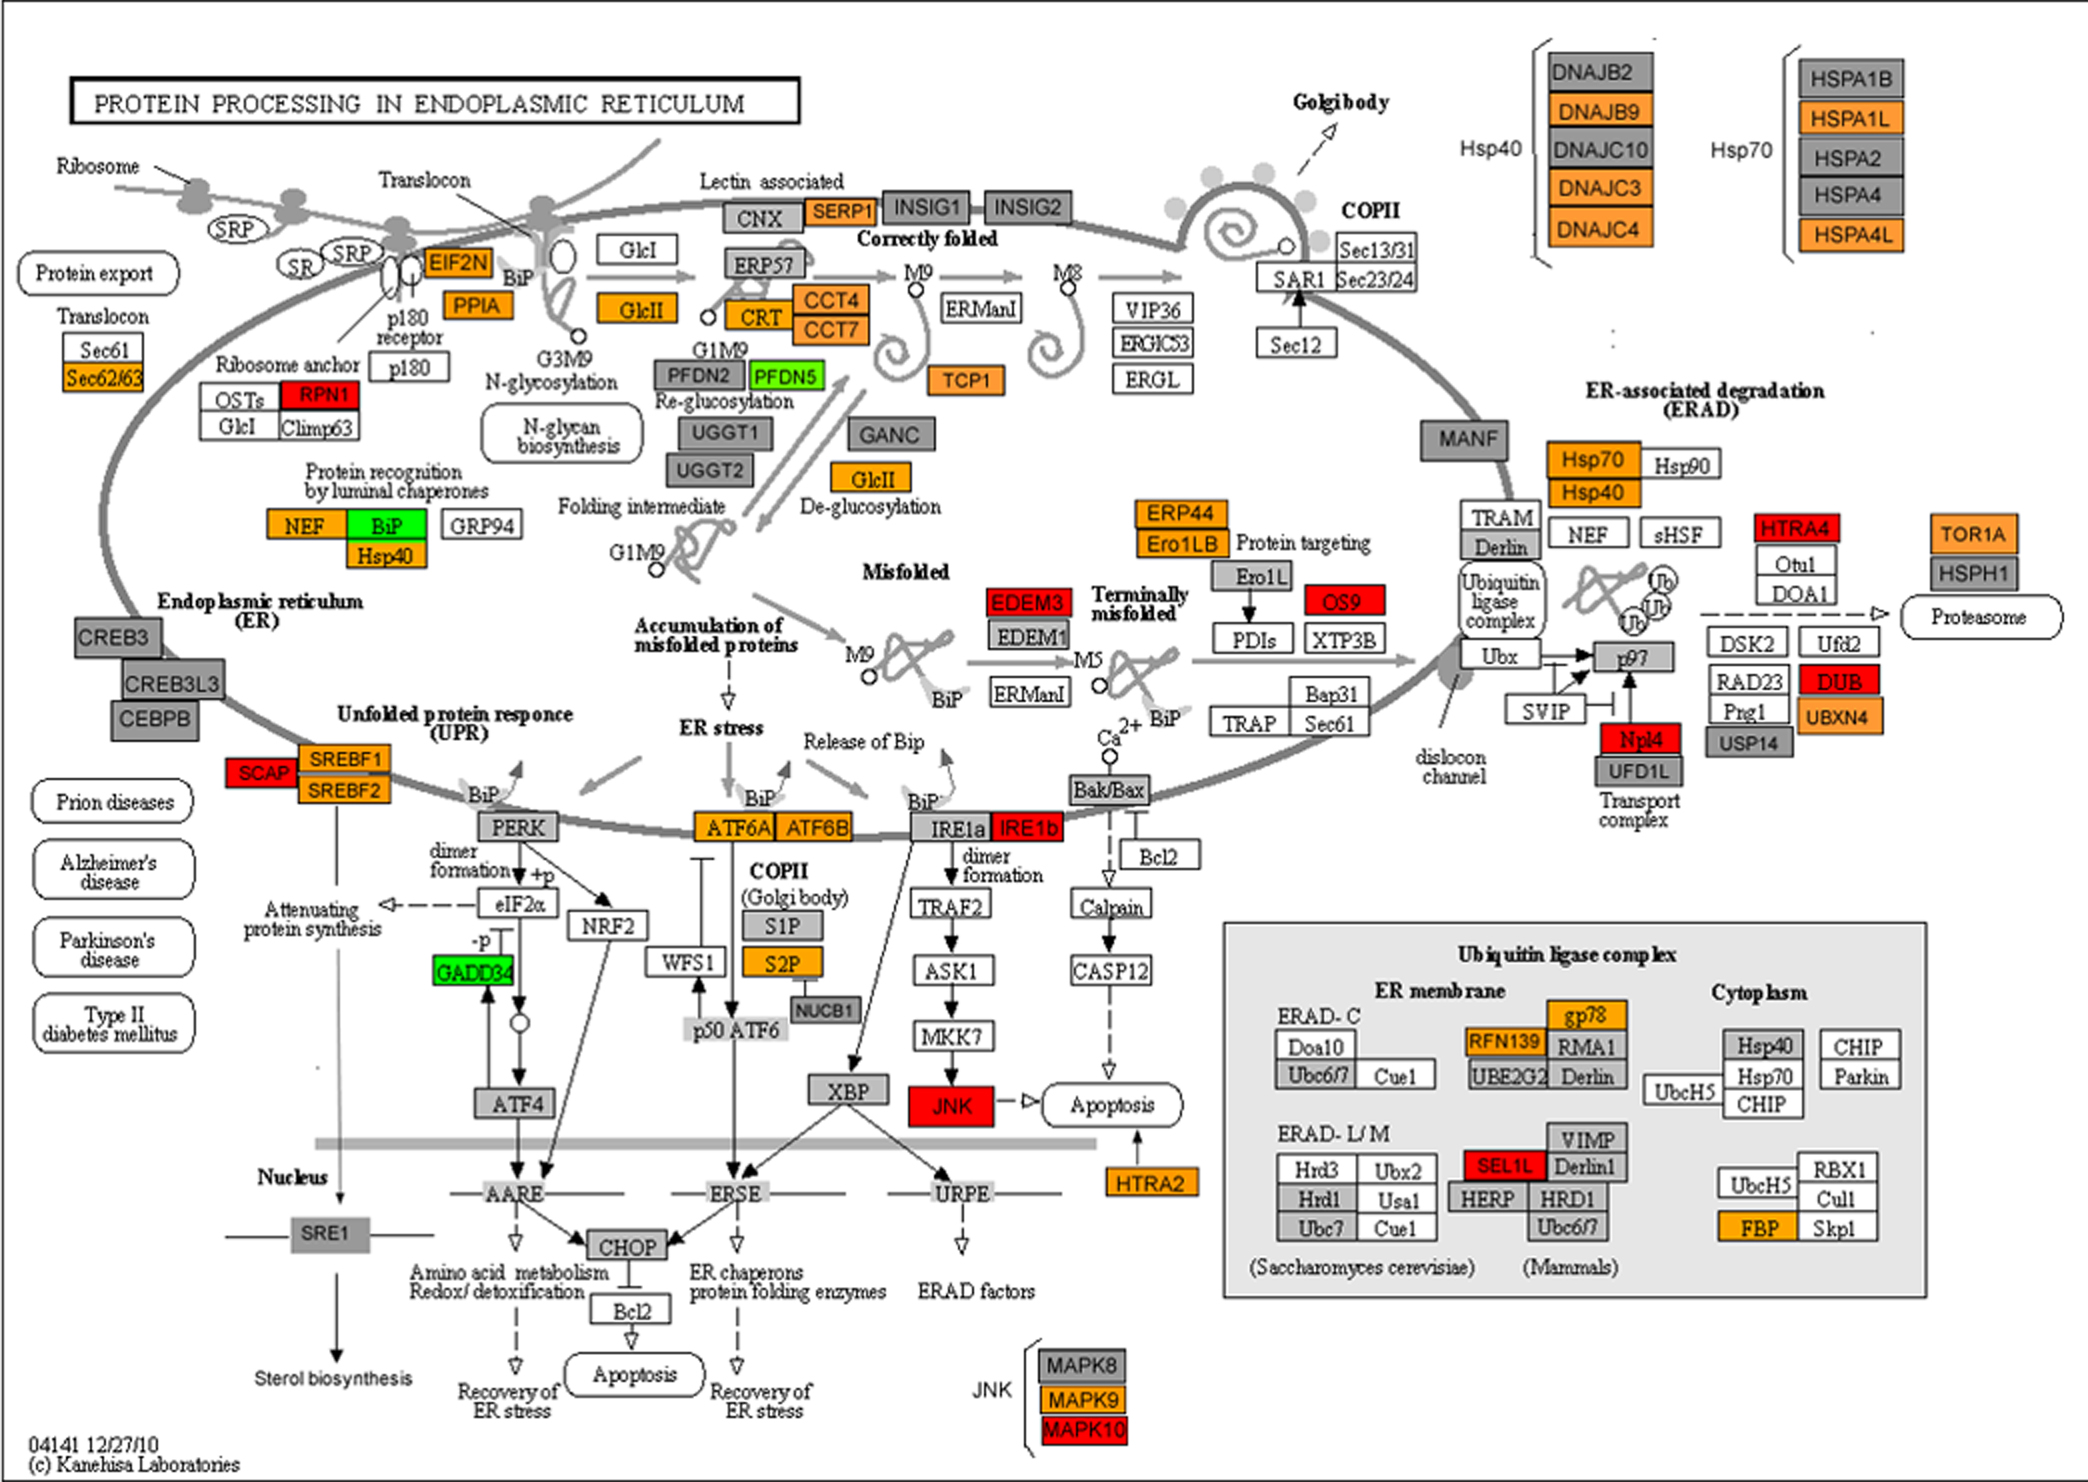
Figure 5. Protein processing pathways in endoplasmic reticulum. The figure [Modified with permission from Kyoto Encyclopedy of Genomes
and Genes (
KEGG) website [
33,
34]— shows various genes that are involved in the protein processing. For FECD samples, genes in Red boxes were up-regulated,
p<0.05, Green box were down-regulated, p<0.05, Orange box: upregulated with p>0.05, Grey box: present in UPR array but not
regulated, White box: not present in UPR array.
 Figure 5 of
Jalimarada, Mol Vis 2014; 20:1668-1679.
Figure 5 of
Jalimarada, Mol Vis 2014; 20:1668-1679.