Figure 4. Validation of UPR PCR array results by quantitative real-time PCR. A: The log fold change for six UPR related genes found to be significantly altered in FECD by PCR array were validated. The
tested genes had their expression regulated similar to a PCR array. * indicates a significant fold change (p<0.05). B: The fold change range for each gene obtained by RT-PCR and PCR array calculated using ΔΔCt standard deviation.
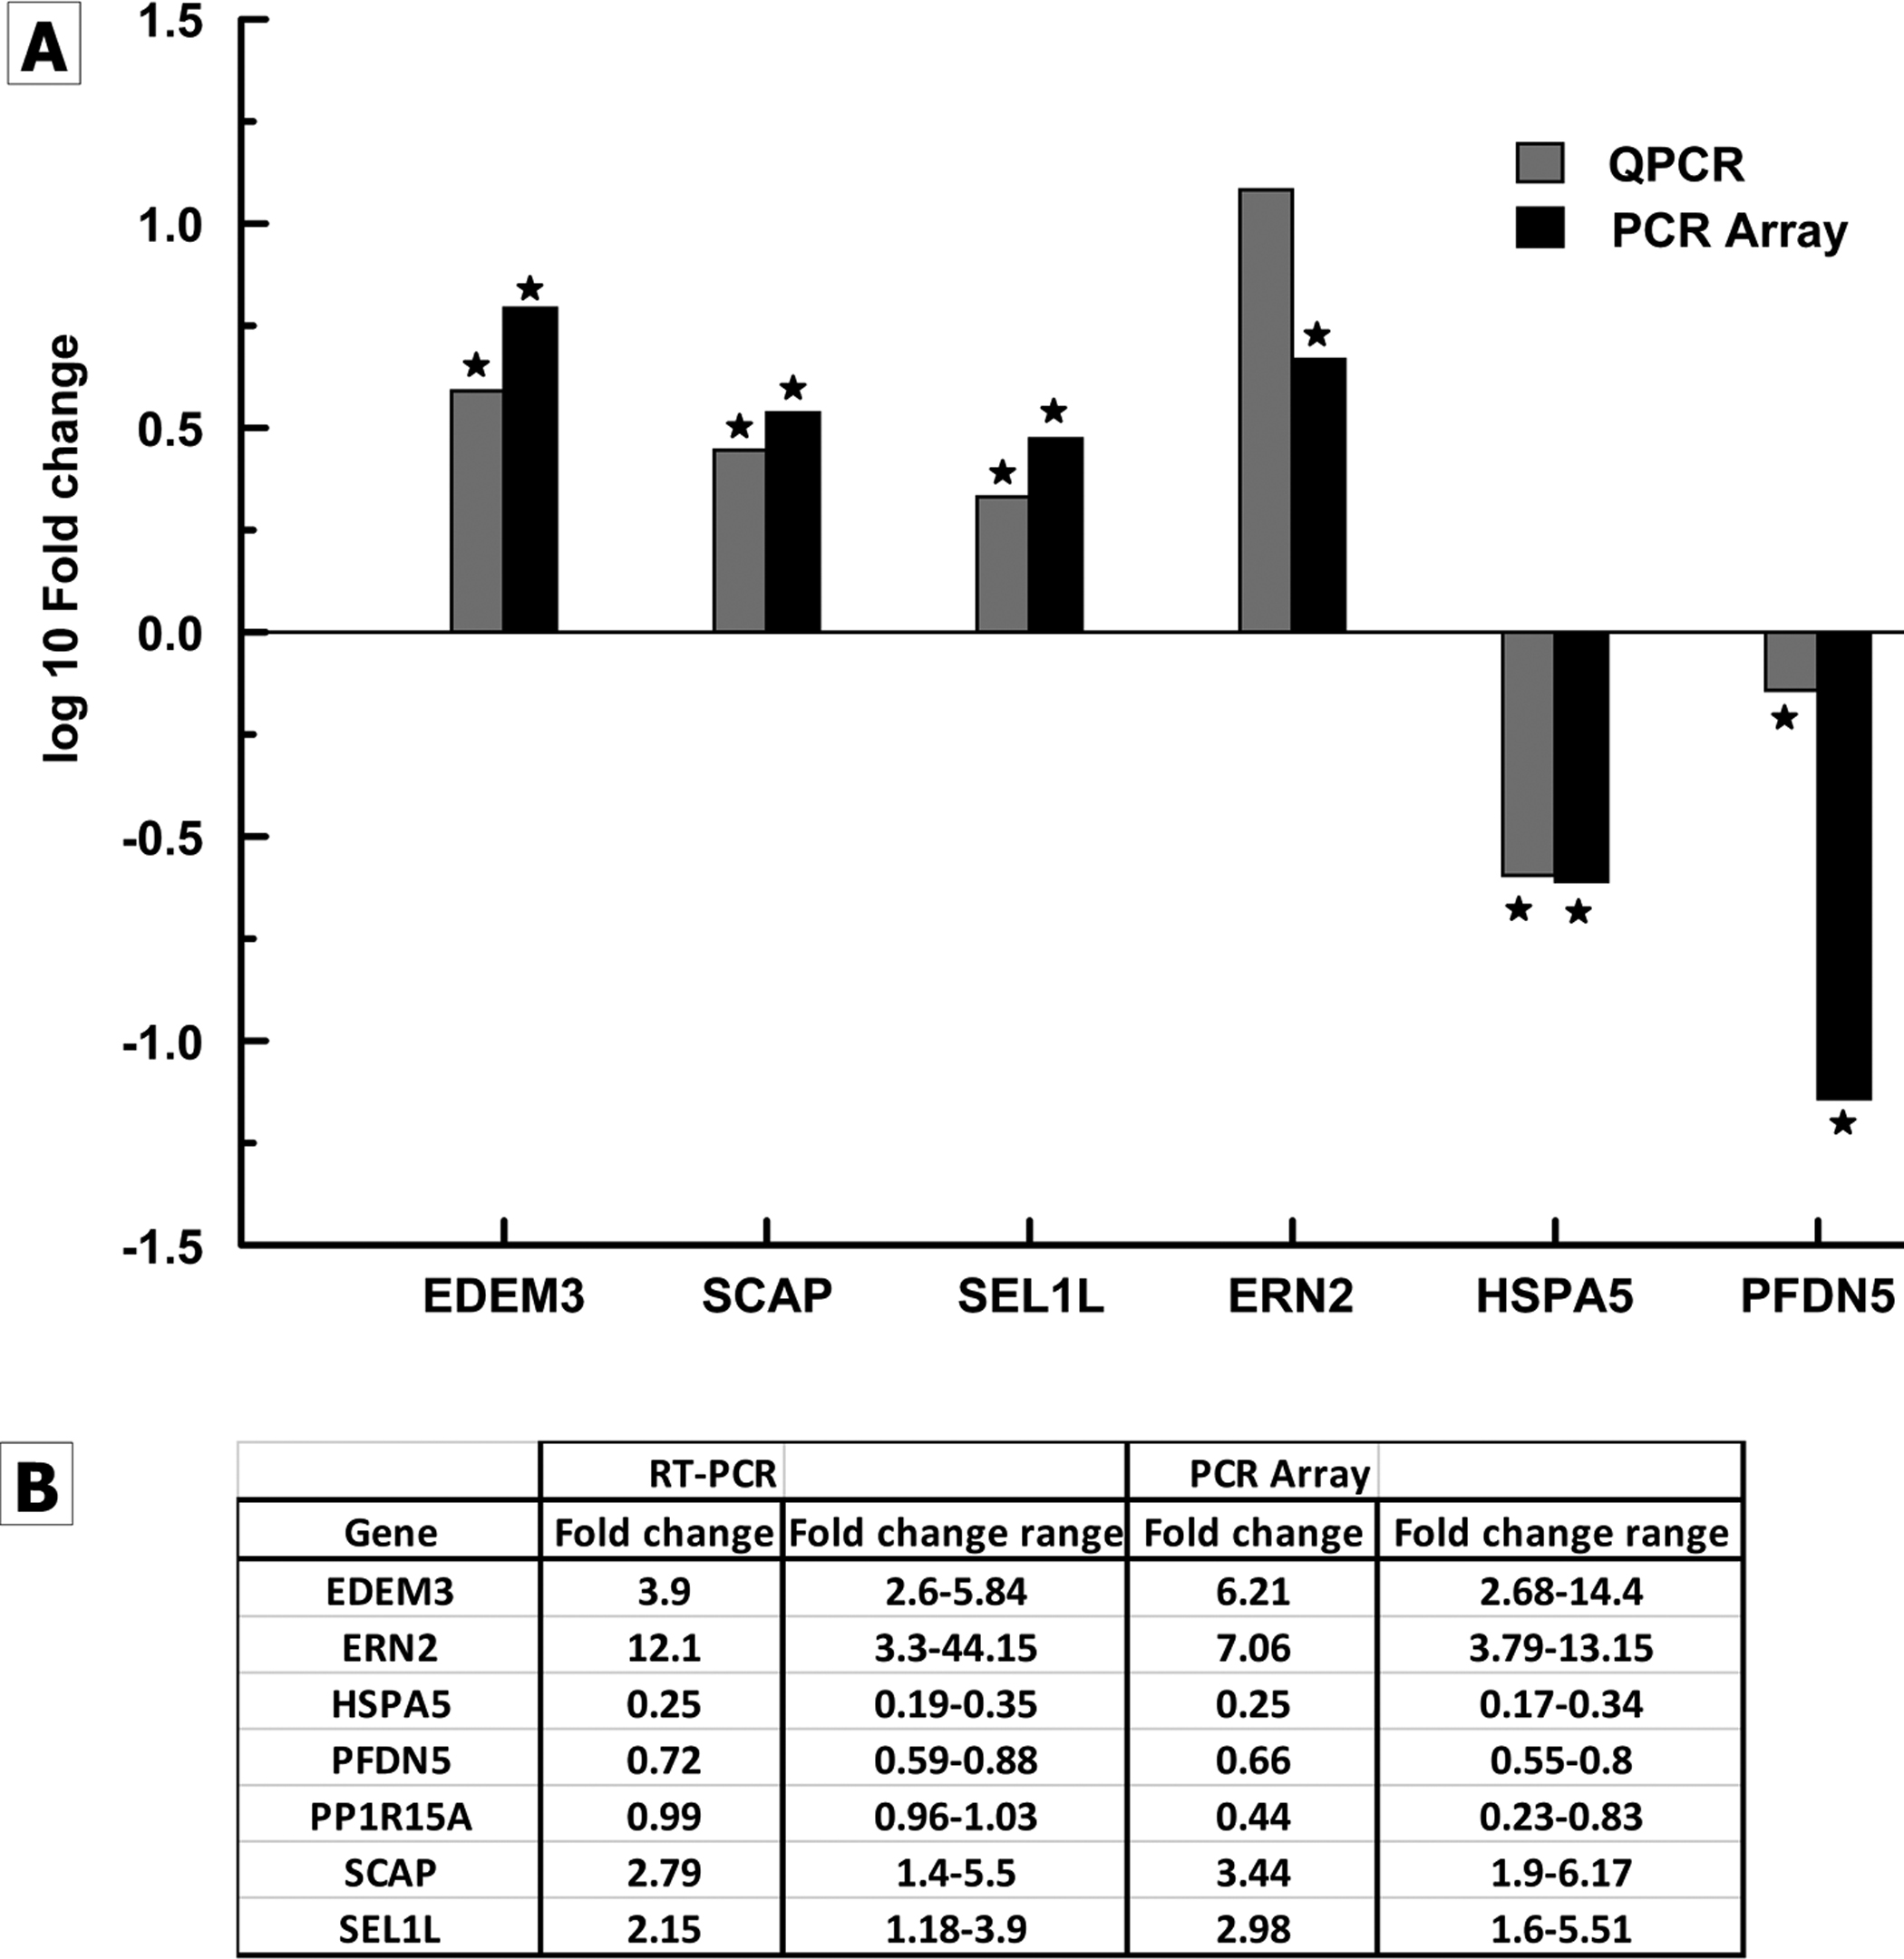
 Figure 4 of
Jalimarada, Mol Vis 2014; 20:1668-1679.
Figure 4 of
Jalimarada, Mol Vis 2014; 20:1668-1679.