Figure 3. Expression profile of all UPR related genes from the PCR array. The scatter plot shows expression levels of UPR related genes
tested in FECD samples compared to normal controls. Of 84 UPR related genes, 42 (51%) were altered. The red circles represent
the genes that had at least a twofold increase in expression, and the green circles are those that had a twofold decrease
in expression compared to the control.
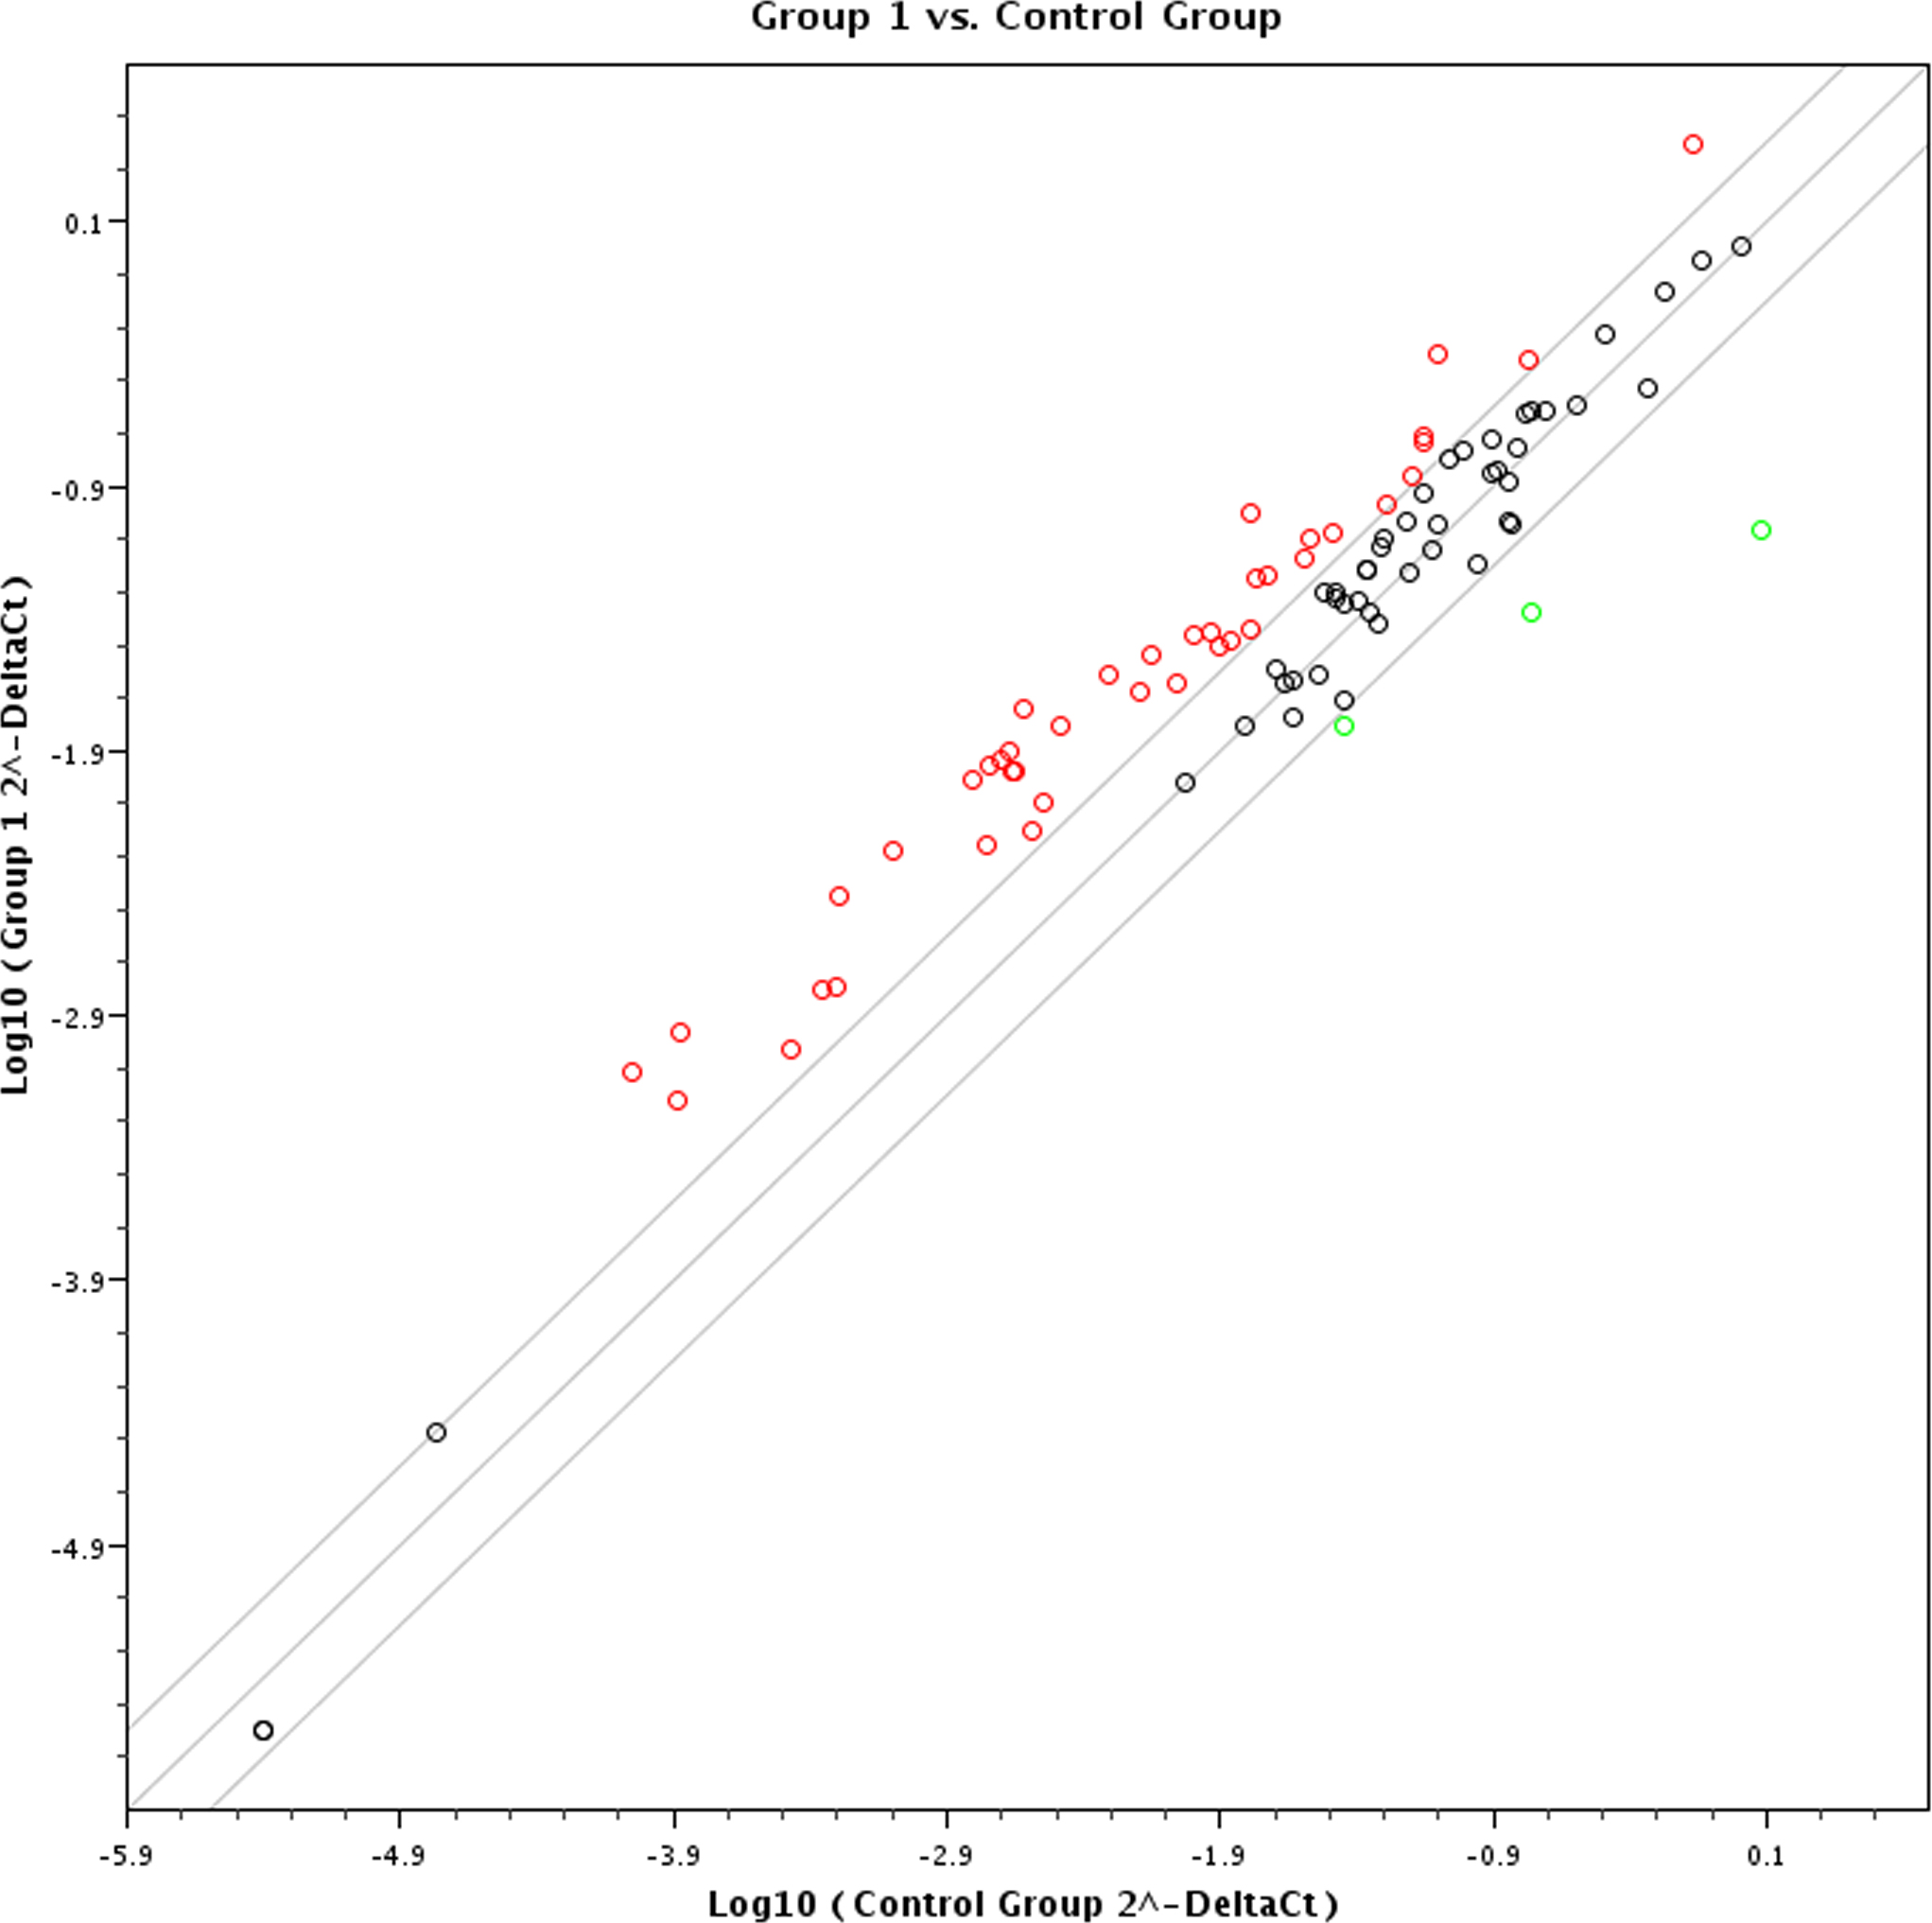
 Figure 3 of
Jalimarada, Mol Vis 2014; 20:1668-1679.
Figure 3 of
Jalimarada, Mol Vis 2014; 20:1668-1679.