Figure 2. Quantitative expression of ion transporters in FECD CE. A: The log fold change for seven ion transporters in FECD CE relative to normal control by quantitative RT-PCR. * represents
the transporters that had a significant change (p<0.05). B: The fold change for each ion transporter along with the fold change range calculated using ΔΔCt standard deviation.
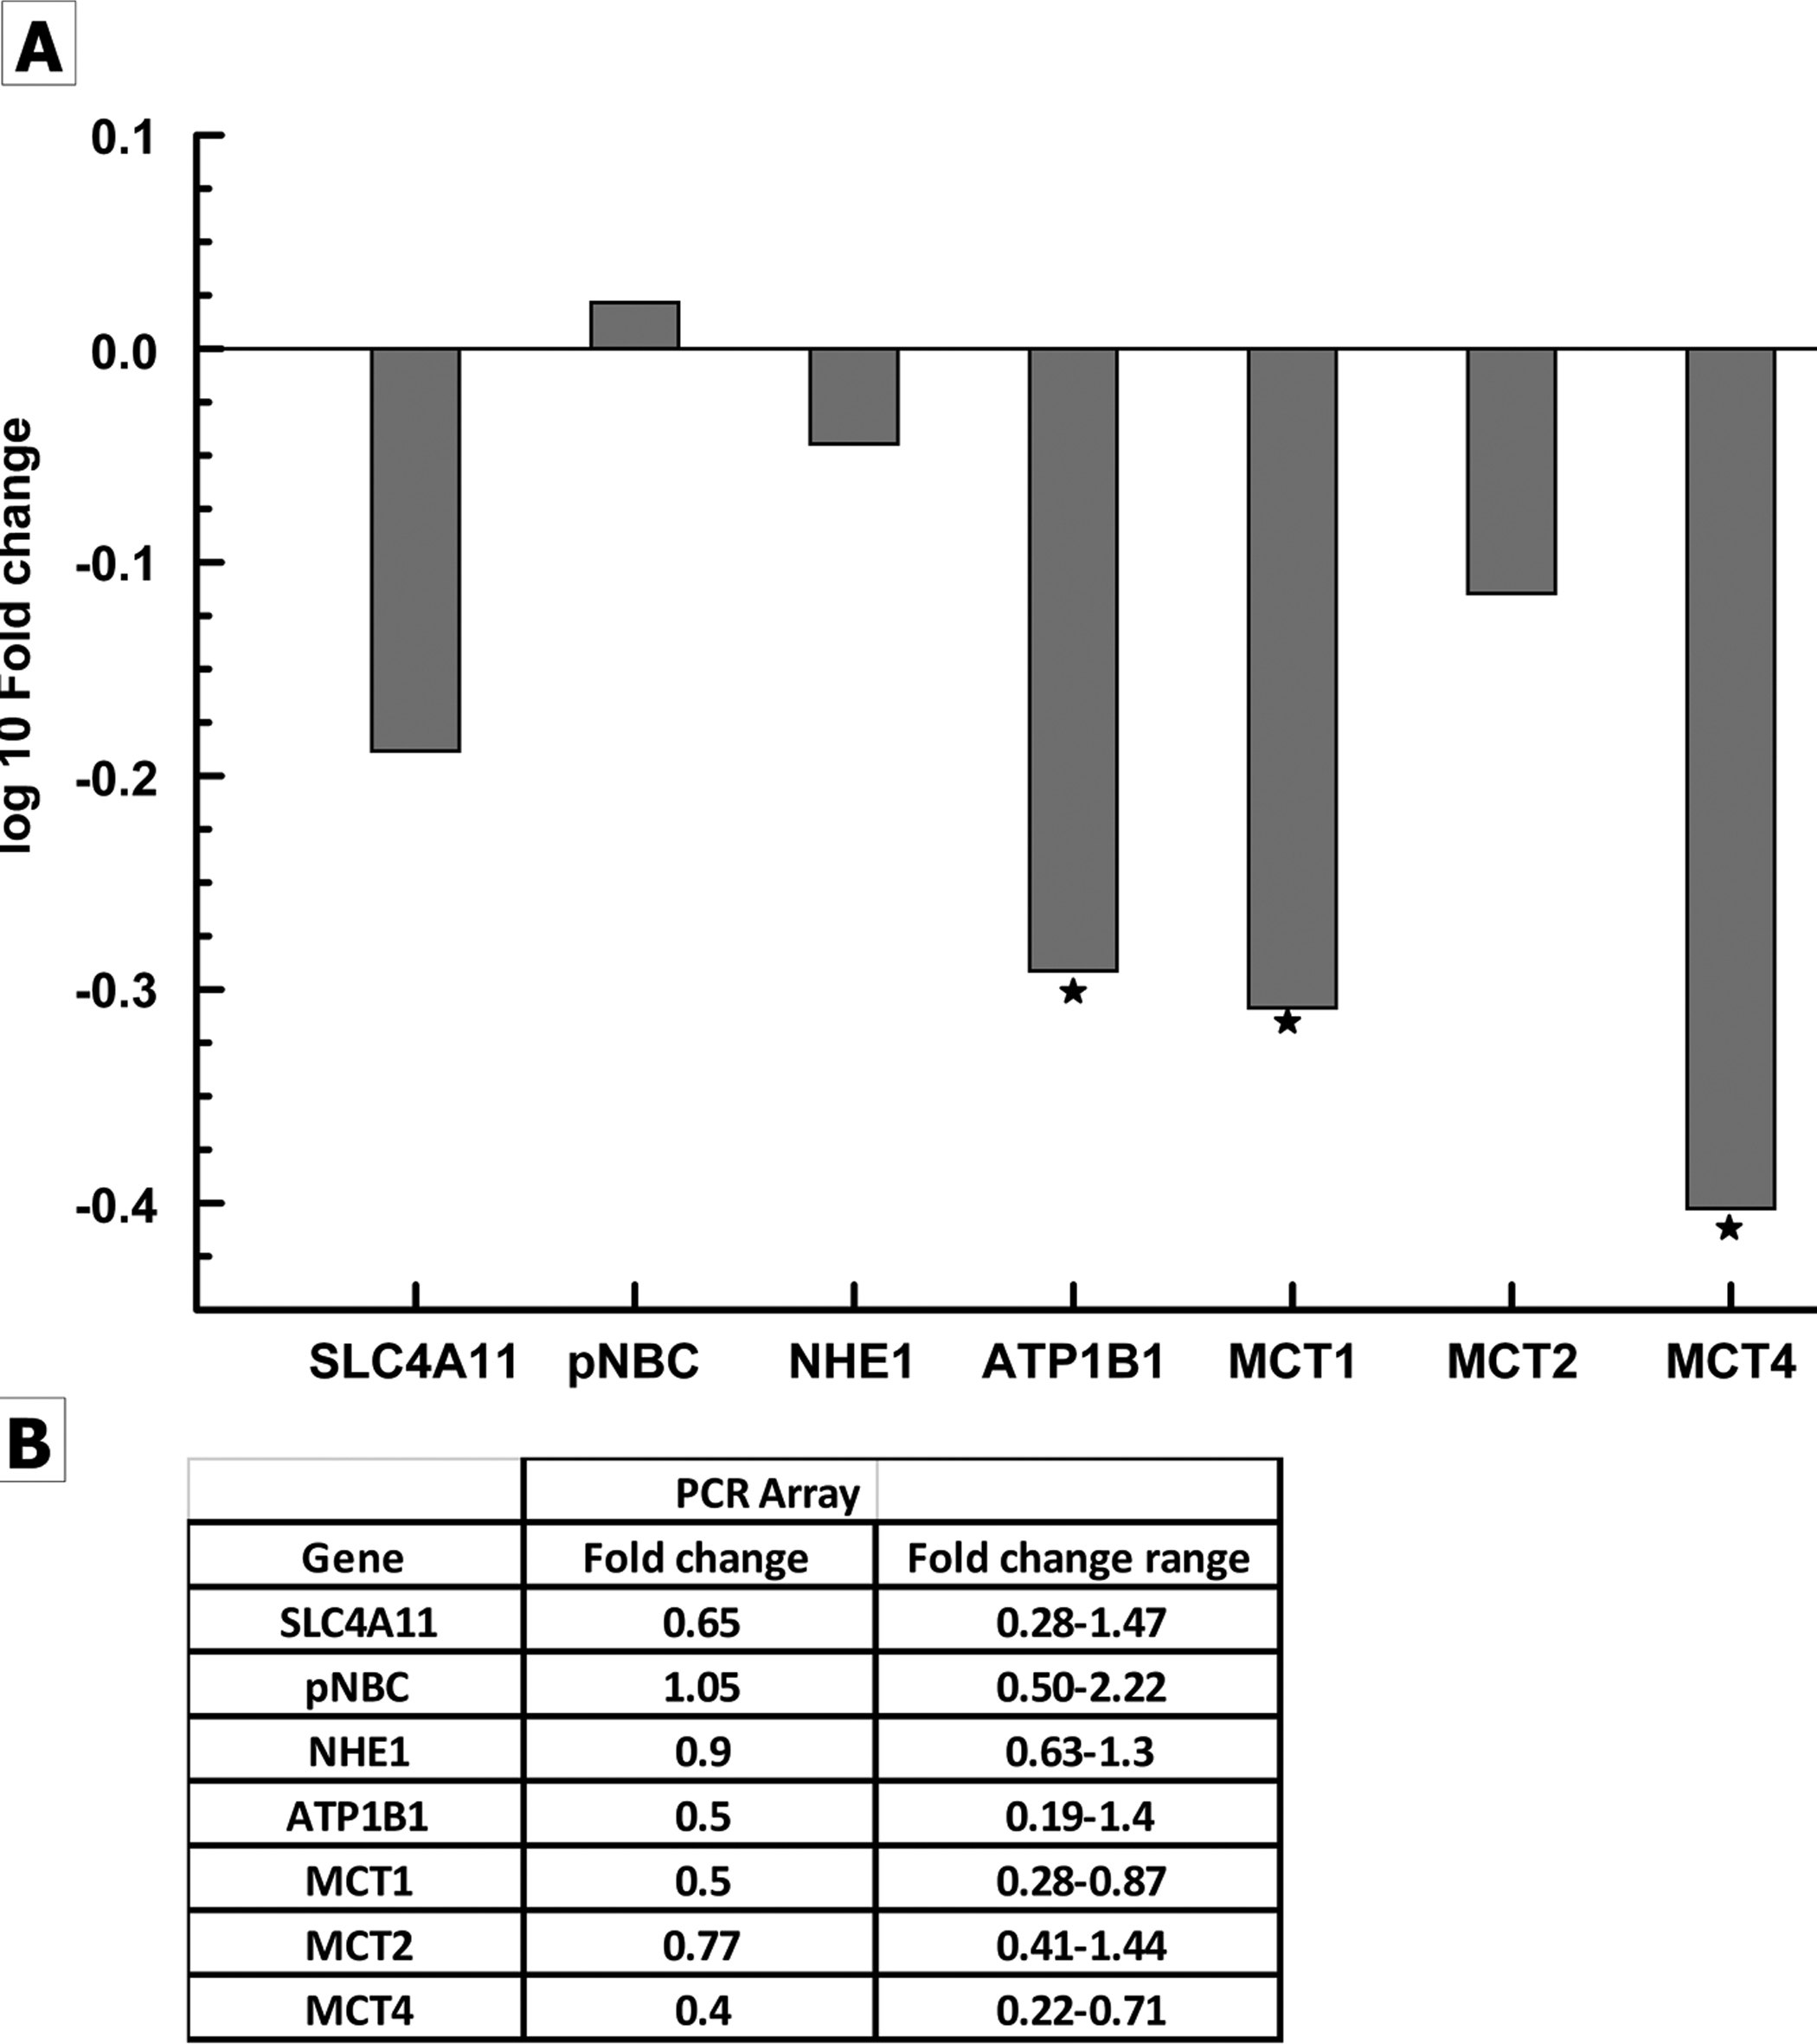
 Figure 2 of
Jalimarada, Mol Vis 2014; 20:1668-1679.
Figure 2 of
Jalimarada, Mol Vis 2014; 20:1668-1679.