Figure 3. Total outflow facility and system resistance. A: Pressure and flow rate traces during alternating constant-pressure measurements at 15 and 25 mmHg. X–X' (withdraw; upper
case for pressure, lower case for flow), X'–Y (preequilibration, preconstant pressure), and Y–Y' (feedback controlled constant-pressure
perfusion) indicate different phases of alternating pressure and flow traces. B: Pressure versus flow rate relationship for 3–4-month-old mice (n = 17). A linear relationship is seen (y=0.0066x–0.034,
R2 = 0.97). C: Pressure–flow rate regression functions for the perfusion system with a 35-G needle (n = 4) compared with C57BL/6 anterior
chamber perfusion using the same needle (n = 17). Slope of the regression function represented resistance (mmHg/min/µl). ■
needle; ● mice eyes; error bars, standard error of the mean.
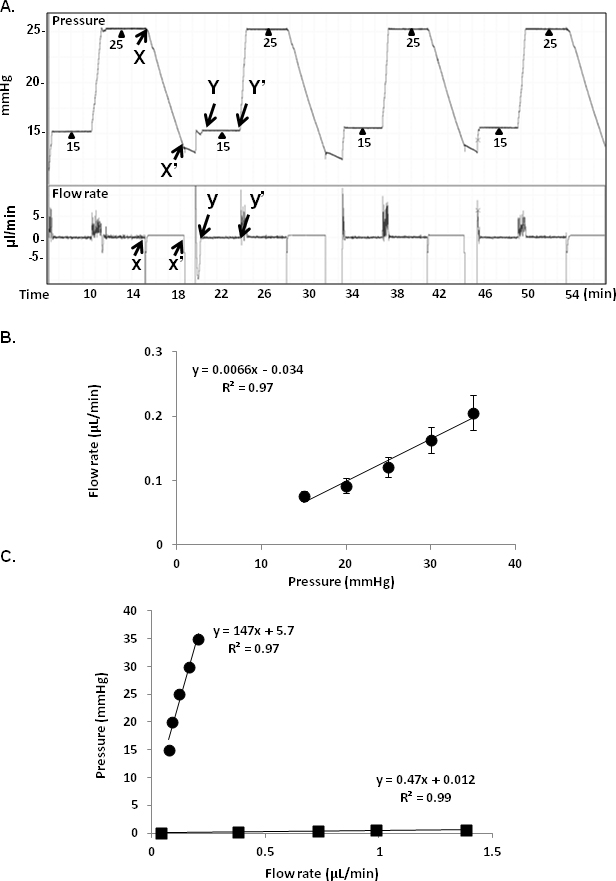
 Figure 3 of
Ko, Mol Vis 2014; 20:163-170.
Figure 3 of
Ko, Mol Vis 2014; 20:163-170.