Figure 2. Example of pressure and flow rate traces for constant-pressure perfusion at pressures of 10–55 mmHg. A: Pressure (y-axis; scale 5 mmHg per square) versus time (x-axis; scale 2 min per square); B: flow rate (y-axis; scale 1 µl/min per square) versus time (x-axis). Spikes in the flow trace reflected a momentary increase in flow rate as the pump sped up. Flow rates then automatically
readjusted to a lower steady rate commensurate with the new set-point pressure.
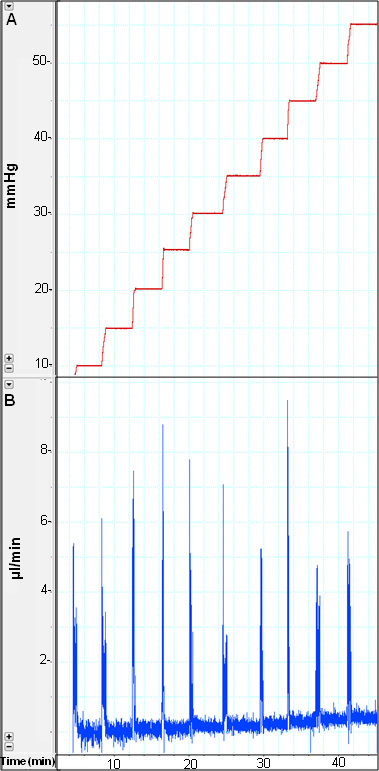
 Figure 2 of
Ko, Mol Vis 2014; 20:163-170.
Figure 2 of
Ko, Mol Vis 2014; 20:163-170.