Figure 5. Total phospholipid in control and S334ter-3 rats. Proportions of phosphatidylcholine (PC), phosphatidylethanolamine (PE),
phosphatidylserine (PS), and phosphatidylinositol (PI) are shown as percentages. Control and S334ter-3 species are represented
by gray and black bars, respectively, as indicated. The mean ± standard deviation results derived from n = 3 samples are shown.
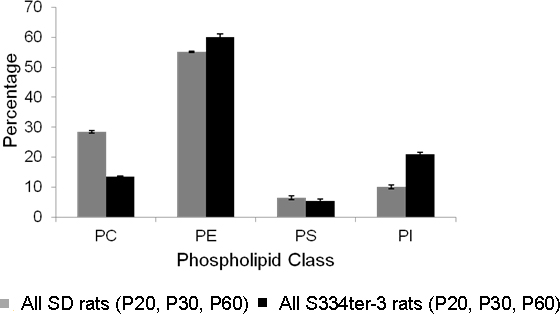
 Figure 5 of
Chen, Mol Vis 2014; 20:1605-1611.
Figure 5 of
Chen, Mol Vis 2014; 20:1605-1611.