Figure 4. Venn diagrams comparing phosphatidylcholine (PC), phosphatidylethanolamine (PE), phosphatidylserine (PS), and phosphatidylinositol
(PI) species in control and S334ter-3 retinas. The numbers represent the PC, PE, PS, and PI species found to be unique or
common in control and S334ter-3 rat retinas at postnatal day (P) 20, P30, and P60. The red and green circles represent the
first versus second described organism below each circle respectively.
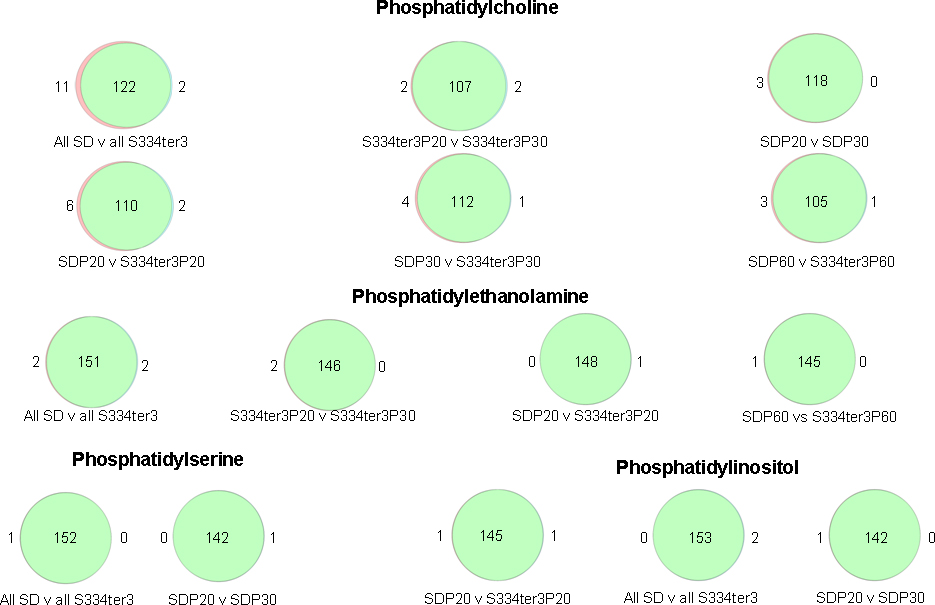
 Figure 4 of
Chen, Mol Vis 2014; 20:1605-1611.
Figure 4 of
Chen, Mol Vis 2014; 20:1605-1611.