Figure 3. Phospholipid side chain distribution over time. Proportions of phosphatidylcholine (PC), phosphatidylethanolamine (PE), phosphatidylserine
(PS), and phosphatidylinositol (PI) species found in control and S334ter-3 rats shown as percentages, distributed according
to the number of carbons present in each of the side chains at postnatal day (P) 20, P30, and P60. The mean ± standard deviation
results derived from n = 3 samples are shown.
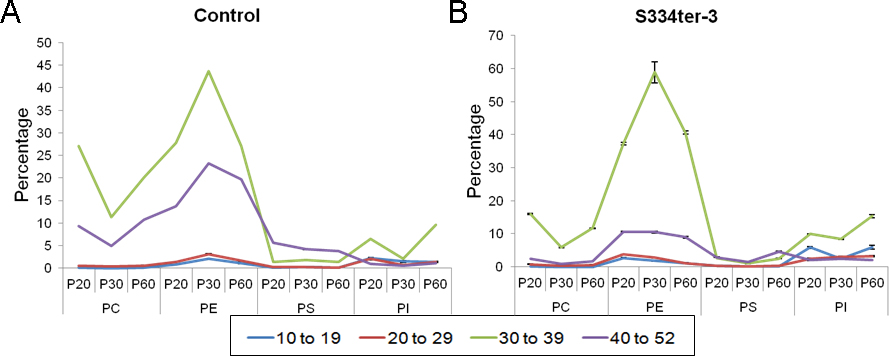
 Figure 3 of
Chen, Mol Vis 2014; 20:1605-1611.
Figure 3 of
Chen, Mol Vis 2014; 20:1605-1611.