Figure 2. Multipoint logarithm of the odds (LOD) score plots for A: the entire genome and B: chromosome 22 under the autosomal recessive model with the phenotype of V:4 set to missing. On the genome-wide plot (A), the region corresponding to the maximum LOD score is marked with a red arrow. The blue triangles on the chromosome 22 plot
(B) mark the positions of the crystallin genes. Note that in B, CRYBB2 and CRYBB3 are outside of the genetic inclusion interval. The hatched bar in B marks the p-arm repetitive region that is not represented among the SNPs in the panel that was screened.
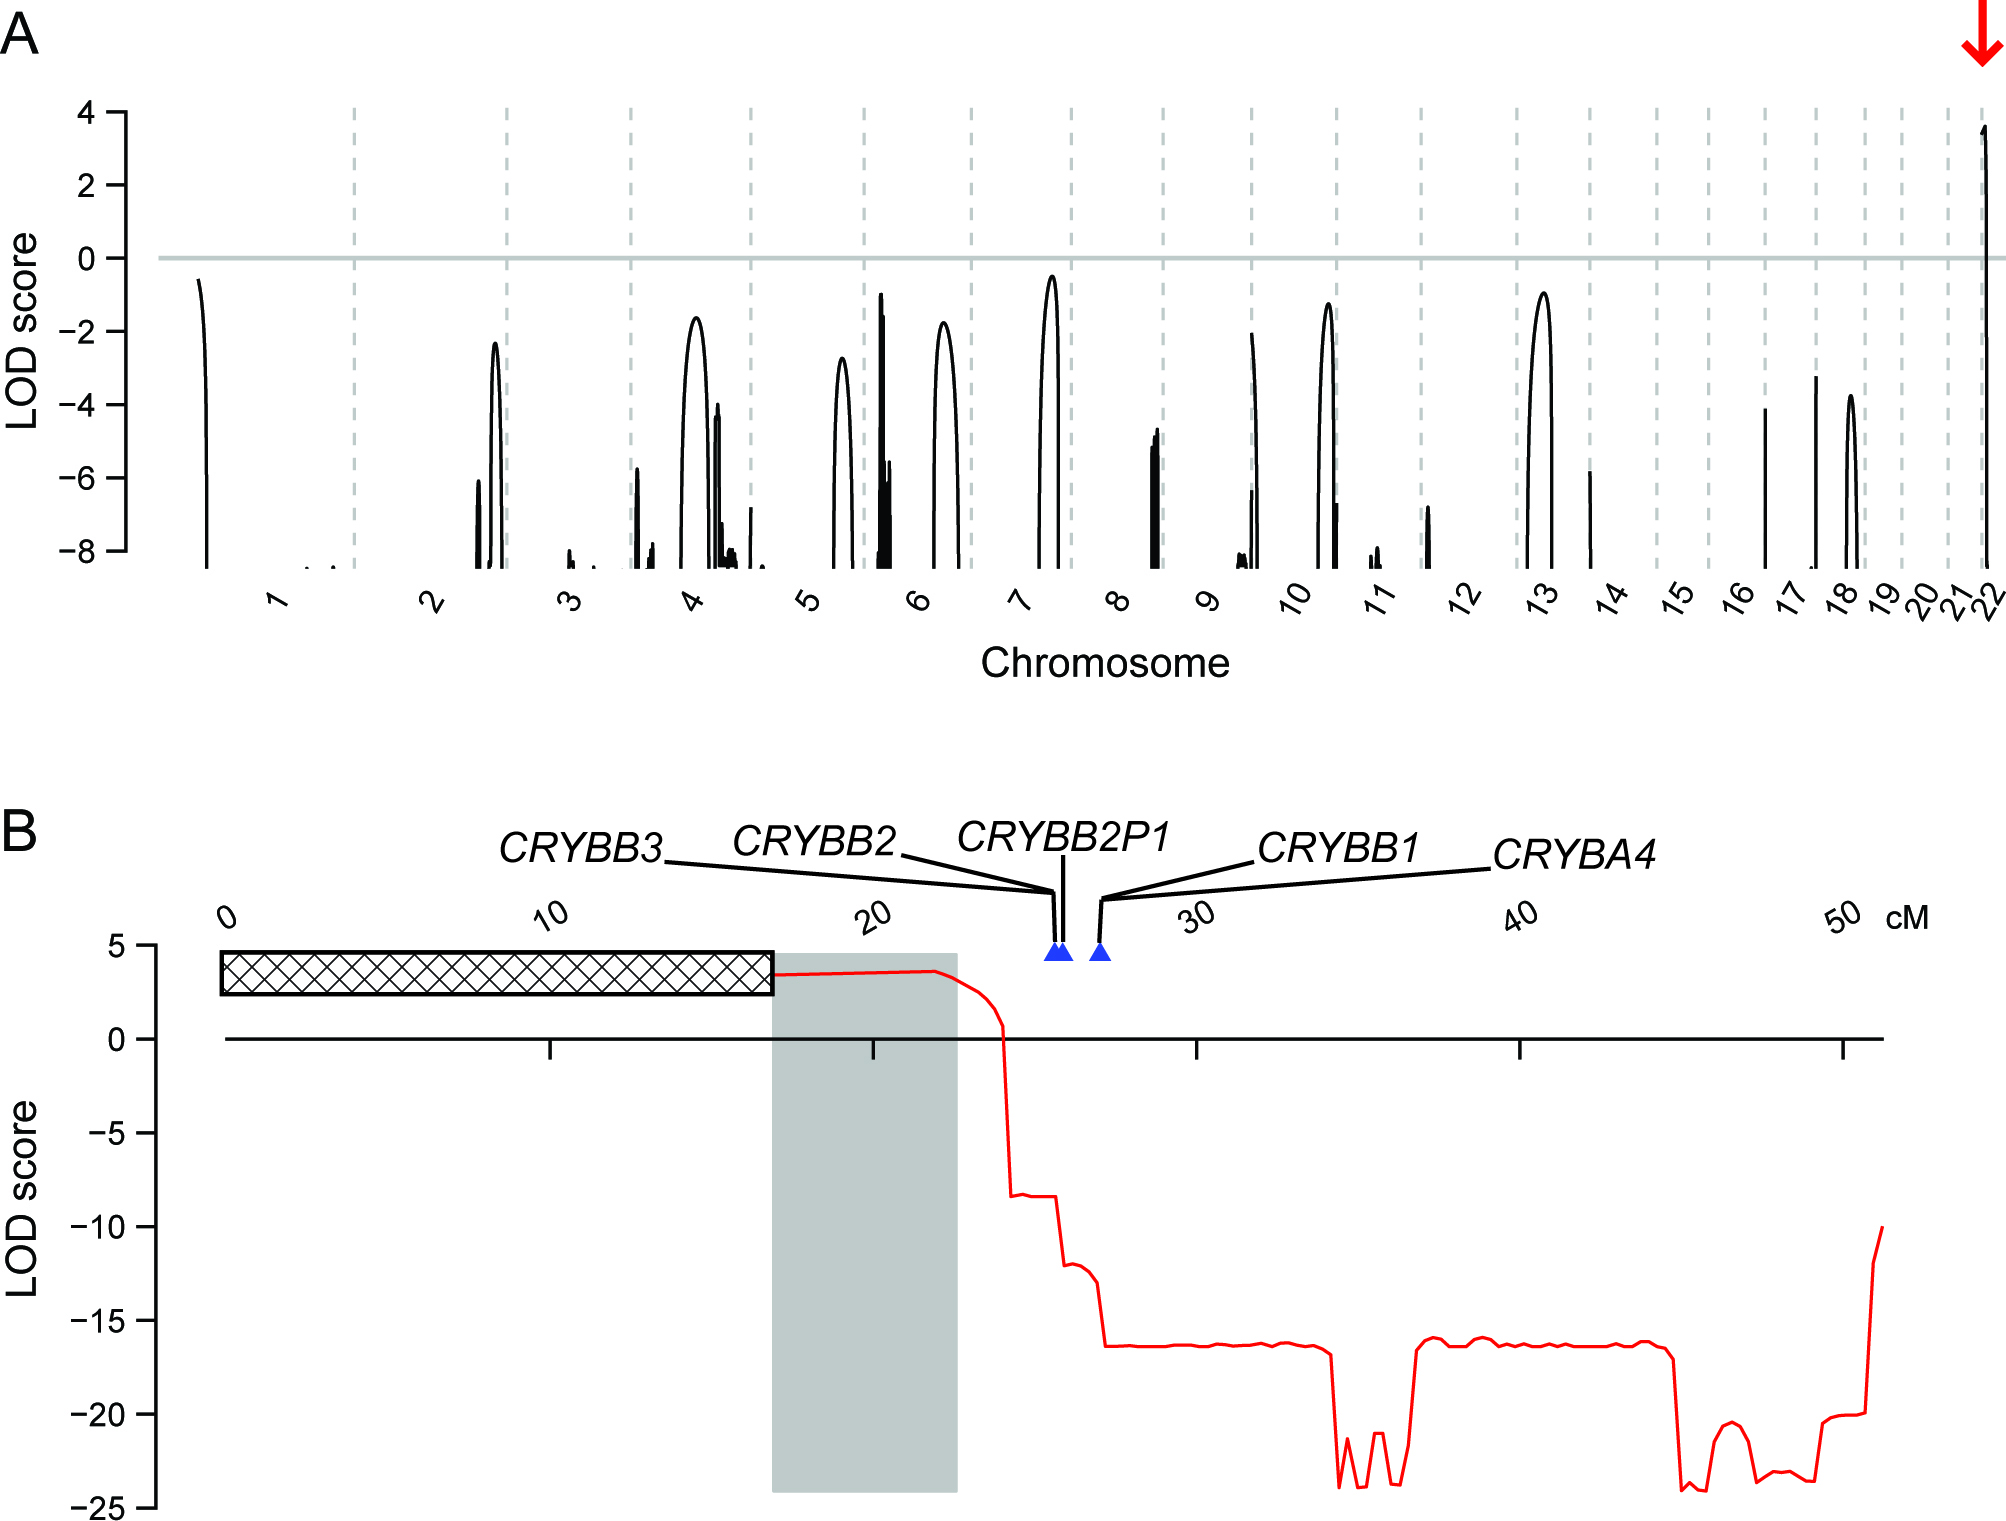
 Figure 2 of
Garnai, Mol Vis 2014; 20:1579-1593.
Figure 2 of
Garnai, Mol Vis 2014; 20:1579-1593.