Figure 1. Real-time PCR (RT-PCR) results for the expression of miR-34a in the aging posterior mouse eye. RT–PCR of the retina (A) and RPE/choroid (B) of isolated miRNA samples at 4, 18, 24, and 32 months of age. There were three samples (n=3) for each of the four time points,
for a total of twelve animals (n=12). miRNA samples from each animal tissue at each time point were run in triplicate, resulting
in each time point representing an average of nine data values. Data were normalized to a geometric mean of three control
small RNAs (U6, sno-202, and sno-135) and calibrated to the 4-month-old sample. The y-axis represents the fold change compared
to the 4-month-old sample. * denotes statistically significant differences (p<0.01). Error bars represent standard deviation
(SD) values.
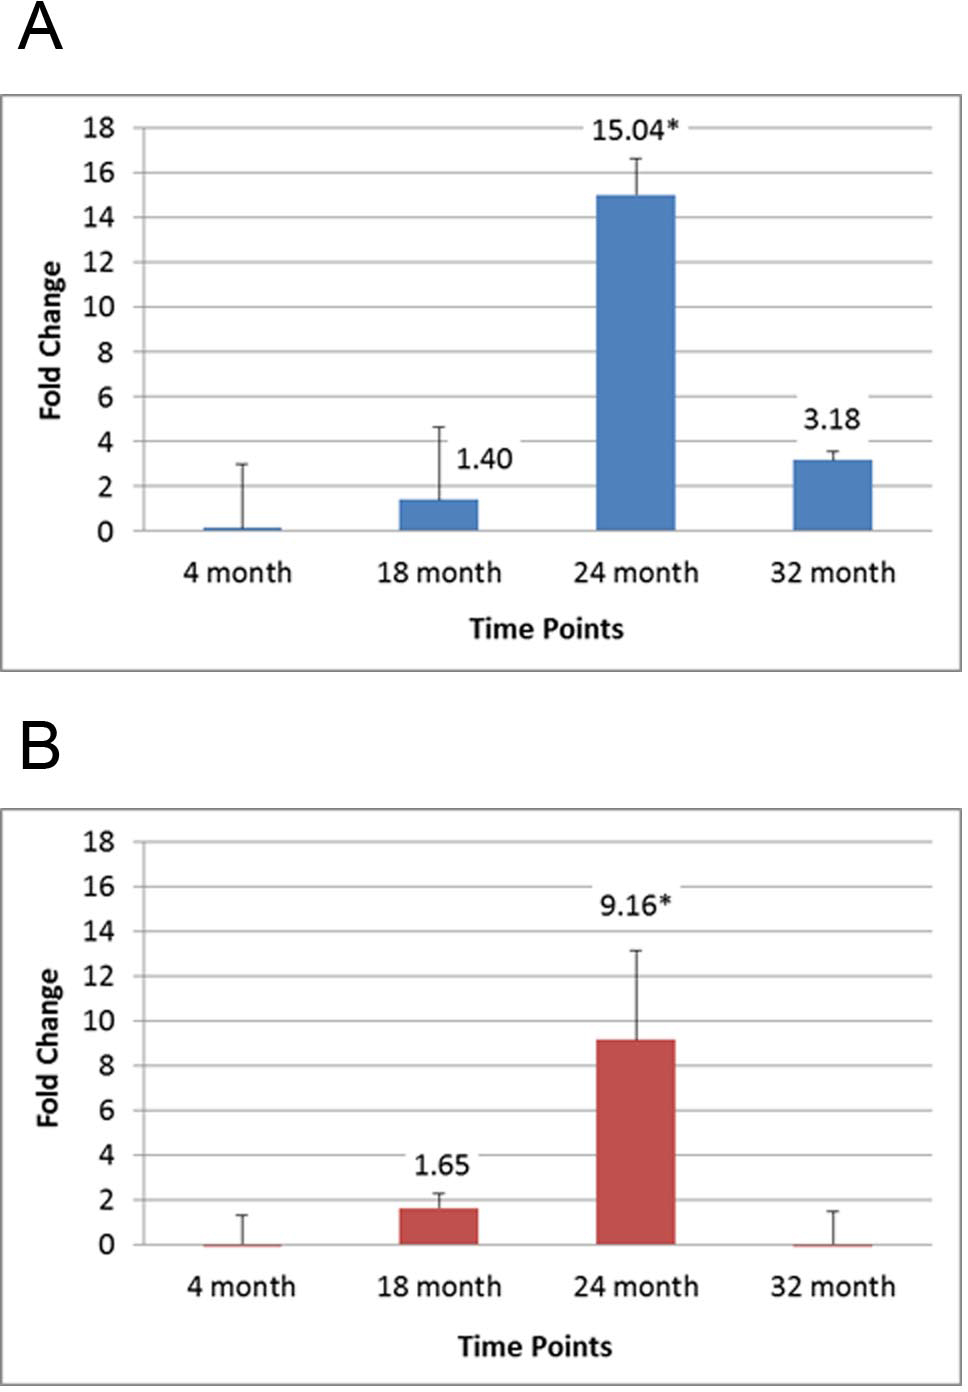
 Figure 1 of
Smit-McBride, Mol Vis 2014; 20:1569-1578.
Figure 1 of
Smit-McBride, Mol Vis 2014; 20:1569-1578.