Figure 7. Modulation of p-AKT (Ser473) activation and Bcl-2 expression in primary retinal Müller cells (RMCs) by E4 under high glucose
culture. E4 stimulation downregulated p-AKT (Ser473) activation (A) and upregulated Bcl-2 expression (B) in primary retinal Müller cells (RMCs) under high glucose culture at different time points (24 h, 48 h, and 72 h; one-way
ANOVA followed by Bonferroni’s test: p-AKT [Ser473], control [D-glucose, 5.6 mM] versus control [D-glucose, 20 mM], t=10.07,
p<0.001; control [D-glucose, 20 mM] versus E4 treatment [20 mM D-glucose + 24 h E4 treatment], t=3.391, p=0.040; control [D-glucose,
20 mM] versus E4 treatment [20 mM D-glucose + 48 h E4 treatment], t=5.191, p=0.001; control [D-glucose, 20 mM] versus E4 treatment
[20 mM D-glucose + 72 h E4 treatment], t=3.315, p=0.047; Bcl-2, control [D-glucose, 5.6 mM] versus control [D-glucose, 20
mM], t=10.76, p<0.001; control [D-glucose, 20 mM] versus E4 treatment [20 mM D-glucose + 48 h E4 treatment], t=3.876, p=0.015;
control [D-glucose, 20 mM] versus E4 treatment [20 mM D-glucose + 72 h E4 treatment], t=5.213, p=0.001; n=4). *: p<0.05, **:
p<0.01, #: p<0.001. E4: Exendin-4. Data are expressed as the means ± SEM. One-way ANOVA followed by Bonferroni’s test.
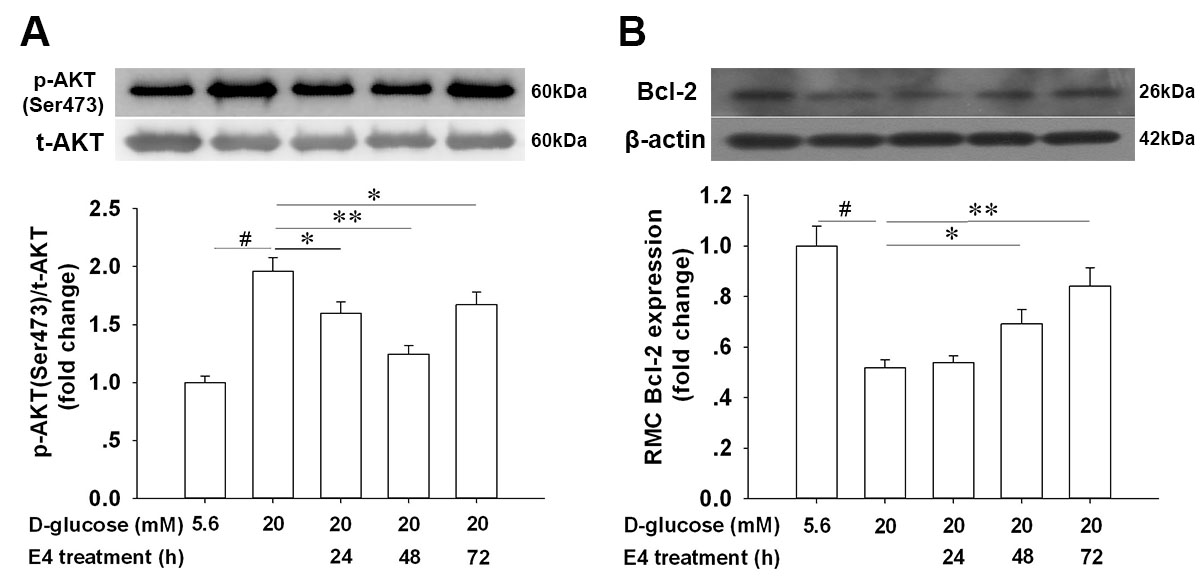
 Figure 7 of
Fan, Mol Vis 2014; 20:1557-1568.
Figure 7 of
Fan, Mol Vis 2014; 20:1557-1568.