Figure 4. Upregulation of GLP-1R protein expression both in vivo and in vitro by E4 stimulation. (A, B) western blot analysis and immunohistochemistry result showed that E4 treatment prevented the downregulation of retinal GLP-1R
expression in GK rats (one-way ANOVA followed by Bonferroni’s test: western blot analysis, G+NS versus G+E4, t=3.792, p=0.013).
GLP-1R was expressed in the inner retinal layers (GCL, IPL, and INL) and inner segment of photoreceptors (IS; n=6). The scale
bar represents 100 μm. GCL, ganglion cell layer; INL, inner nuclear layer; IPL, inner plexiform layer; ONL, outer nuclear
layer. NEG: negative control (Wistar control); Control: Wistar rats treated with sham injection (normal saline); G+NS: GK
rats treated with sham injection (normal saline); G+E4: GK rats treated with E4. (*: p<0.05, **: p<0.01, #: p<0.001, n=4).
C: Immunostaining of GLP-1R in primary retinal Müller cells (RMCs) from Wistar rats. The scale bar represents 100 μm. GLP-1R
was highly expressed in RMCs membrane and cytoplasm (red). NEG: negative control. (D) Western blot analysis showed that E4 upregulated the GLP-1R protein expression of RMCs under high glucose culture (20 mM)
at different time points (24 h, 48 h, and 72 h). One-way ANOVA followed by Bonferroni’s test: Control (D-glucose, 5.6 mM)
versus control (D-glucose, 20 mM, t=3.421, p=0.046; E4 control [5.6 mM D-glucose + 48 h E4 treatment] versus control [D-glucose,
20 mM], t=3.764, p=0.021; control [D-glucose, 20 mM] versus E4 treatment [20 mM D-glucose + 48 h E4 treatment], t=4.396, p=0.005;
n=4). E4 had no effect on RMCs under normal glucose (5.6 mM) treatment after 48 h. Data are expressed as the means ± SEM.
One-way ANOVA followed by Bonferroni’s test.
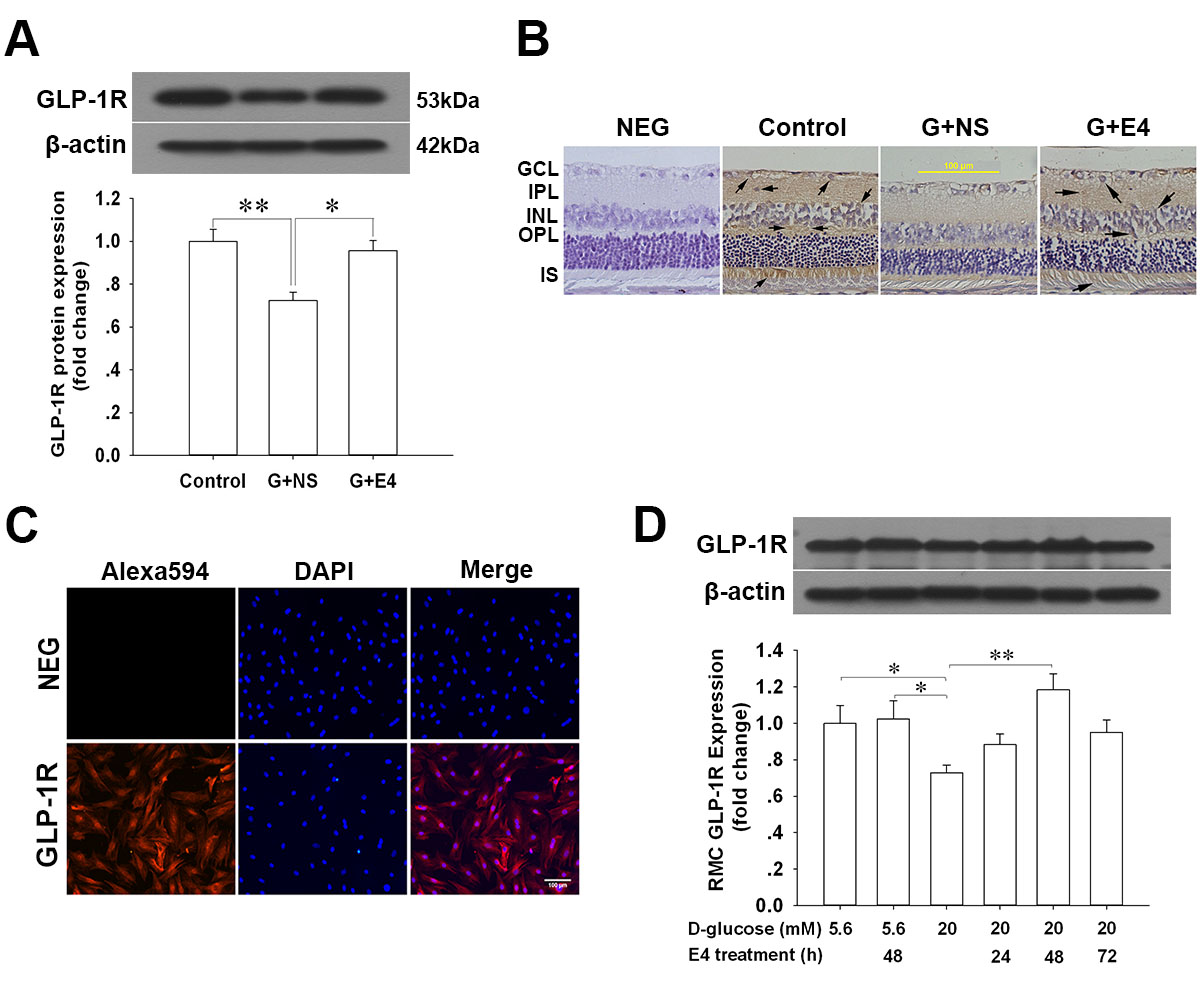
 Figure 4 of
Fan, Mol Vis 2014; 20:1557-1568.
Figure 4 of
Fan, Mol Vis 2014; 20:1557-1568.