Figure 2. Cones and bipolar cells in in EE and ST mice. Vertical retinal sections from rd10 EE (A) and rd10 ST (B) mice stained with M/L and S cone-opsin (red signal) and PKC alpha (green signal) antibodies. The number of residual cones
is higher in the enriched environment (EE) samples (arrows). There are no major differences between the two groups of animals
in the morphology of rod bipolar dendritic trees, which appear retracted almost completely in the two samples, with the exceptions
of scattered dendrites emerging form the cell bodies of some rod bipolar cells in the EE retinas (arrows in inset). Some bipolar
cell somas are misplaced in the outer retina, at the same height as the photoreceptors (asterisk). C, D: Staining with cone arrestin antibodies (red signal) in the rd10 EE (C) and rd10 ST (D) sections. Note the more elaborate shape of cones visible in C. Insets: High magnification of the OPL in which the cones are stained red with arrestin and the synaptic ribbons (arrows)
green with ribeye antibodies. INL = inner nuclear layer; IPL = inner plexiform layer; OPL = outer plexiform layer.
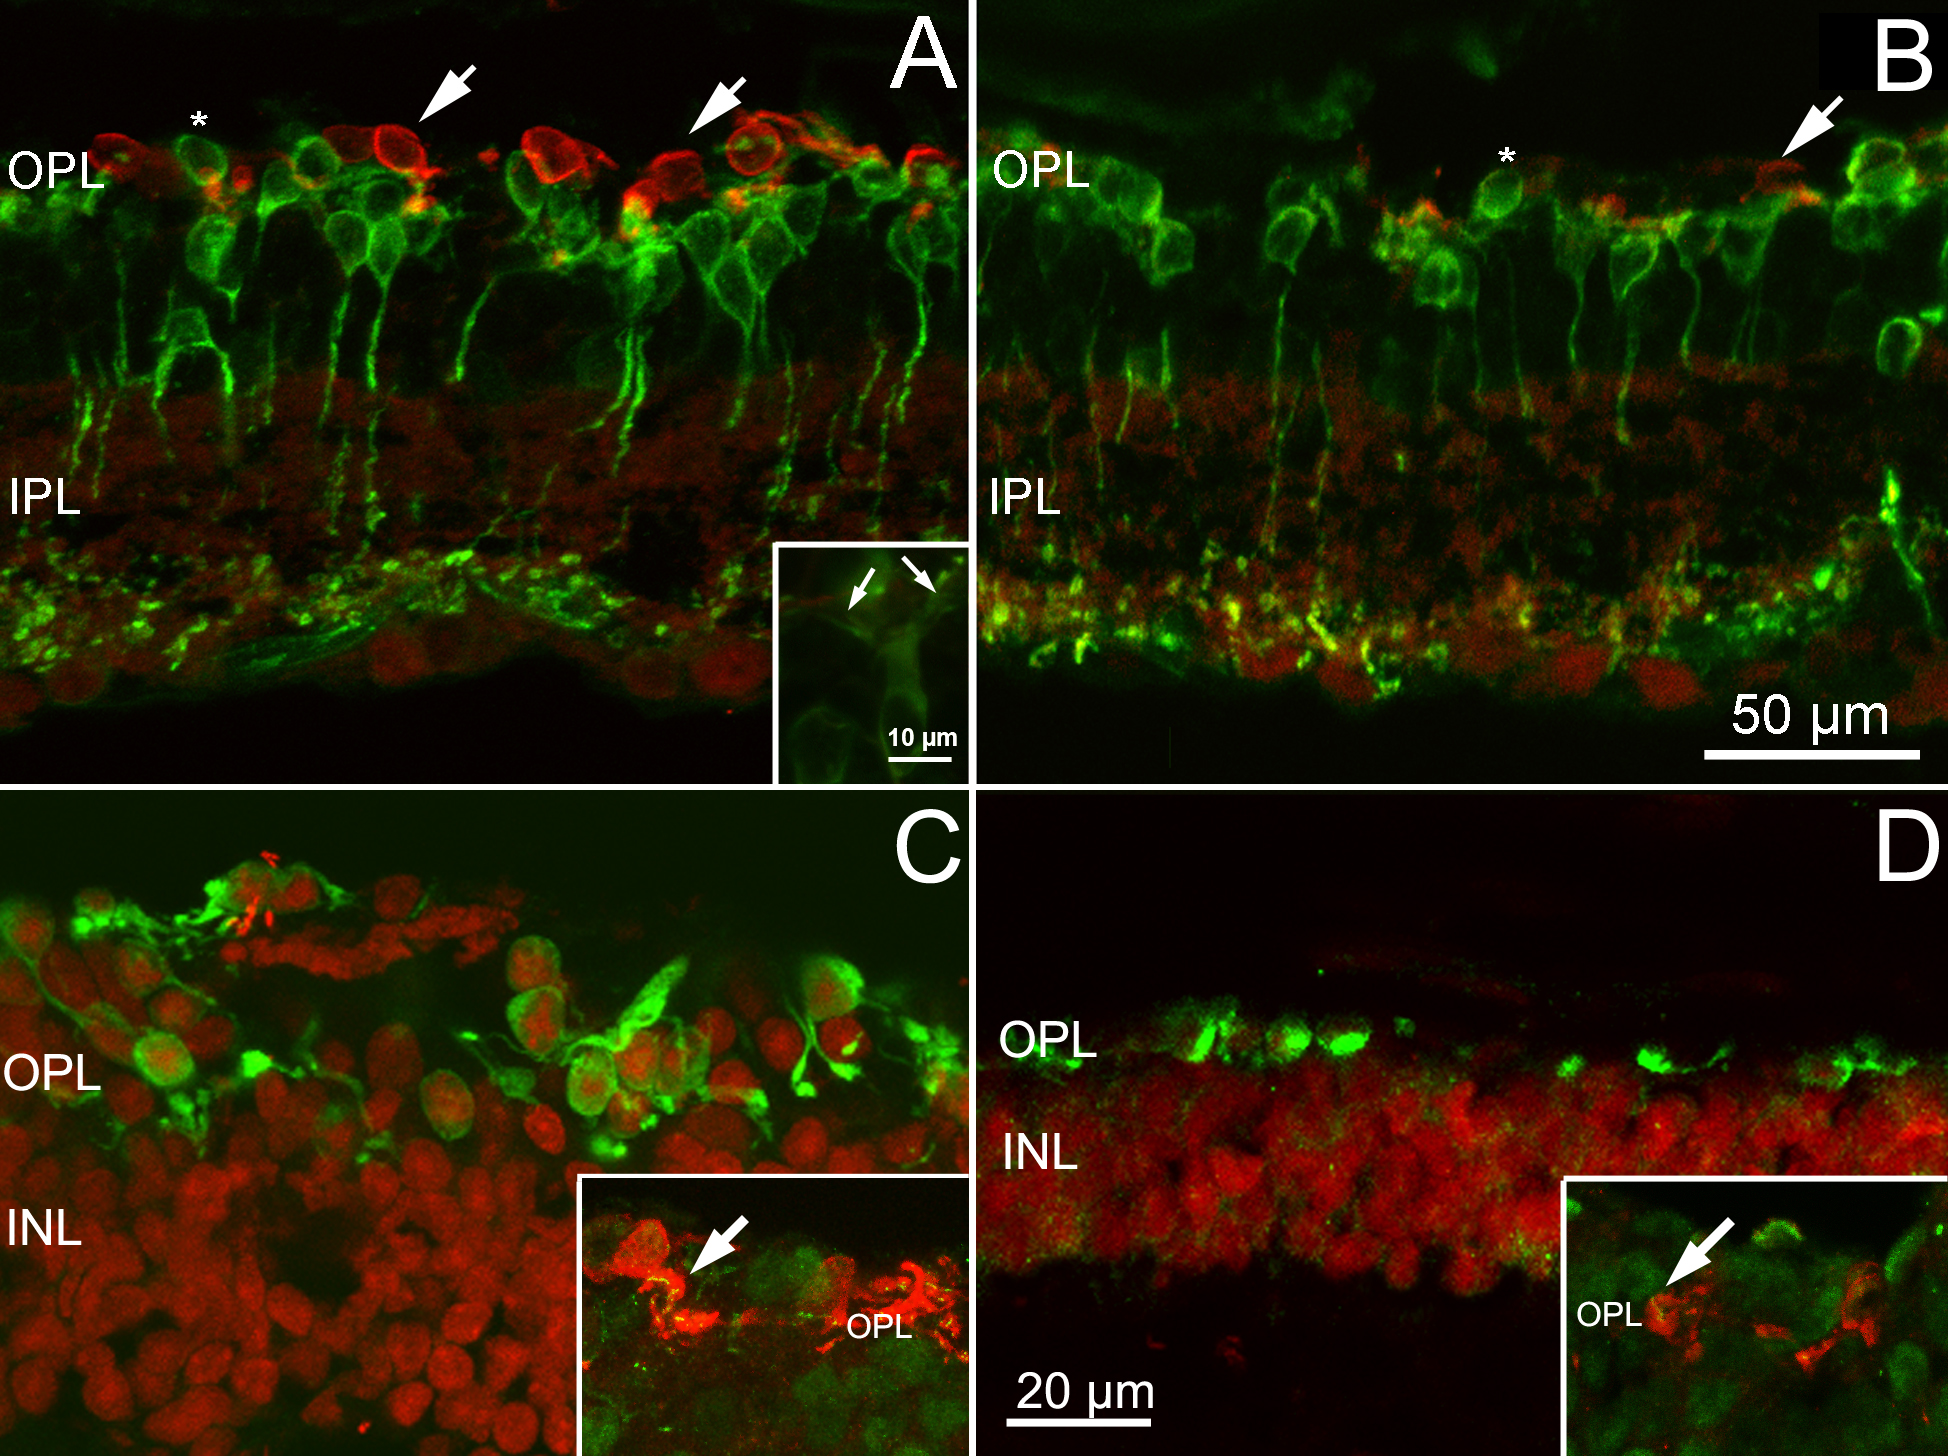
 Figure 2 of
Barone, Mol Vis 2014; 20:1545-1556.
Figure 2 of
Barone, Mol Vis 2014; 20:1545-1556.