Figure 5. Gene Ontology enrichment analysis for genes upregulated in epithelial and genes upregulated in fiber cells. The top ten most
enriched Gene Ontology (GO) terms are shown for the cellular component (A), molecular function (B), and biologic function (C).
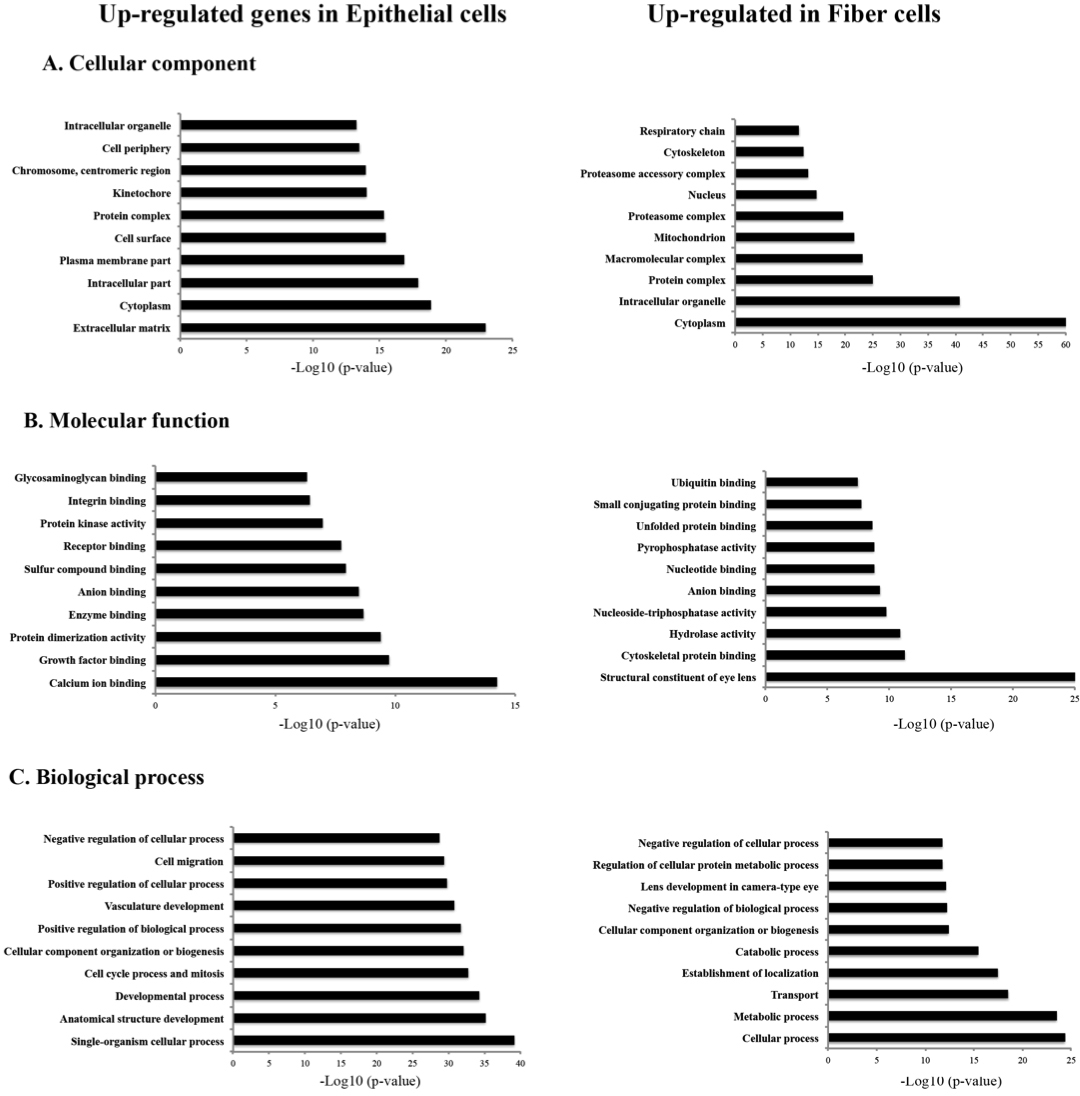
 Figure 5 of
Hoang, Mol Vis 2014; 20:1491-1517.
Figure 5 of
Hoang, Mol Vis 2014; 20:1491-1517.