Figure 4. Comparison of RNA-Seq and microarray analysis with RT-qPCR validation assays. Quantitative measurement of gene expression
was determined with quantitive reverse transcription (qRT)–PCR for newborn FVB lenses (blue) and for 13 day-old C57/BL6 lenses
(green) compared with RNA-Seq for newborn FVB lenses (red) and microarray for 13-day-old C57/BL6 (purple) for 19 genes with
a wide range of expression levels. A: Genes that were upregulated in fiber cells. B: Genes that were upregulated in epithelial cells. C: Genes with large fold changes in the expression levels. Fold change was calculated based on gene expression in the fiber
cells relative to the epithelial cells. Negative values indicate lower expression in the fiber cells compared with the epithelial
cells. Genes that have more than 1.5 fold changes (dashed line) are differentially expressed genes.
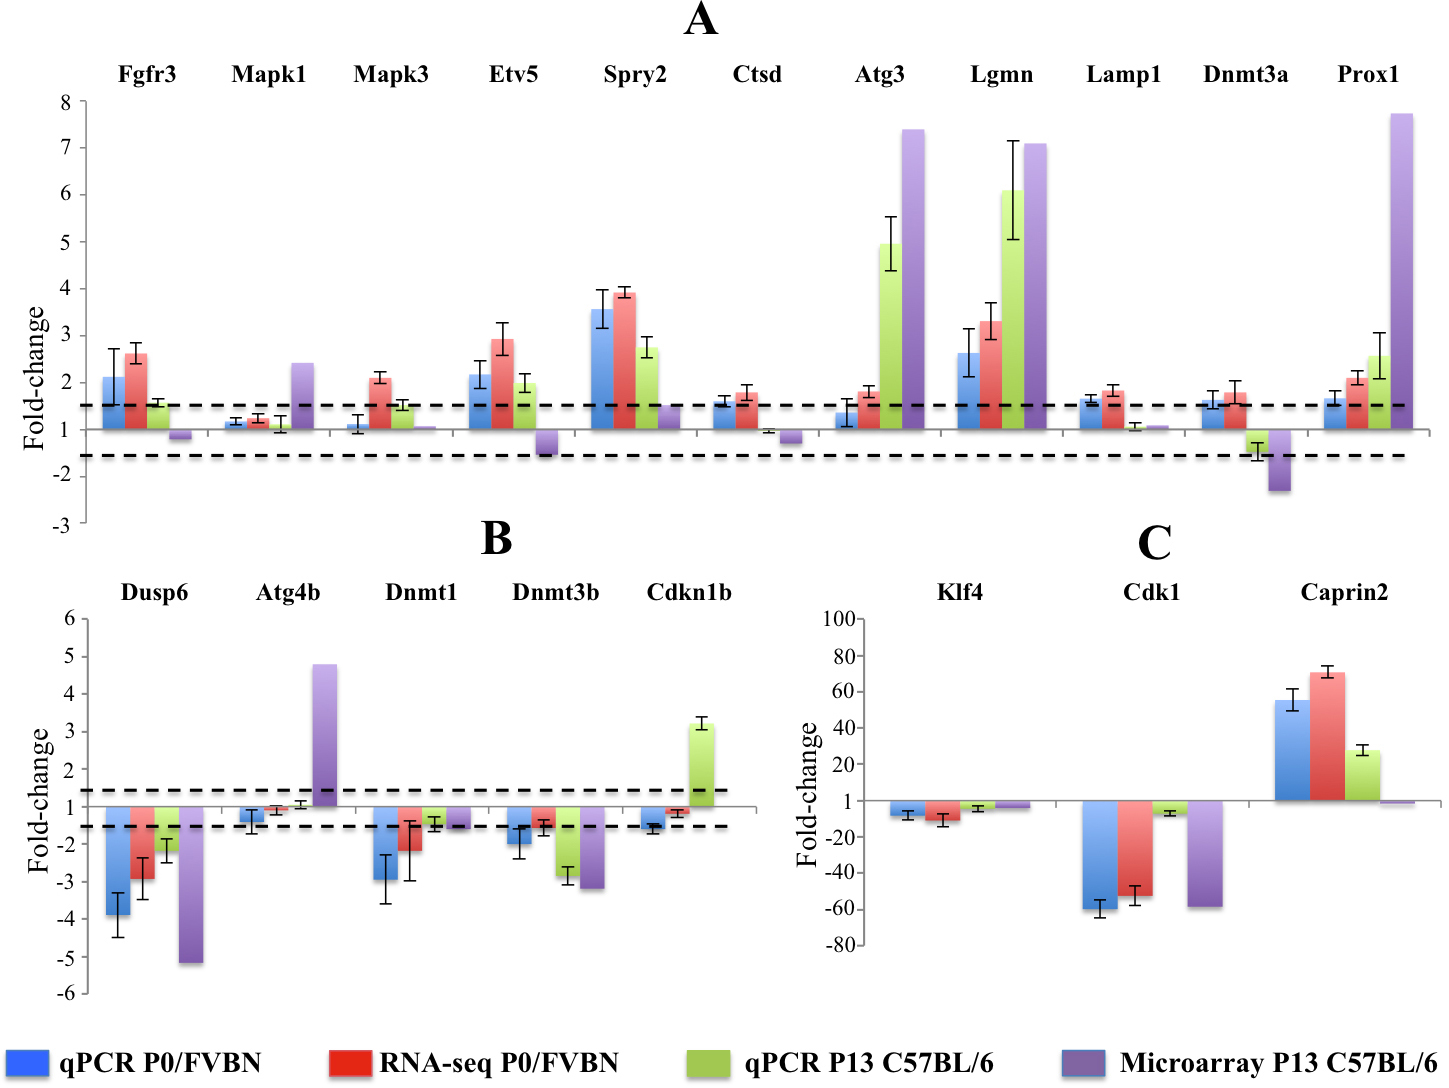
 Figure 4 of
Hoang, Mol Vis 2014; 20:1491-1517.
Figure 4 of
Hoang, Mol Vis 2014; 20:1491-1517.