Figure 2. Top 30 most significant differentially expressed protein-coding genes between epithelial and fiber cells ranked by adjusted
p value. A: Genes with upregulated expression in epithelial cells. B: Genes with upregulated expression in fiber cells. In the heatmap, white represents low levels of expression while red represents
high levels. Sample abbreviations: E1, E2, and E3: epithelial replicates; F1, F2, and F3: fiber replicates.
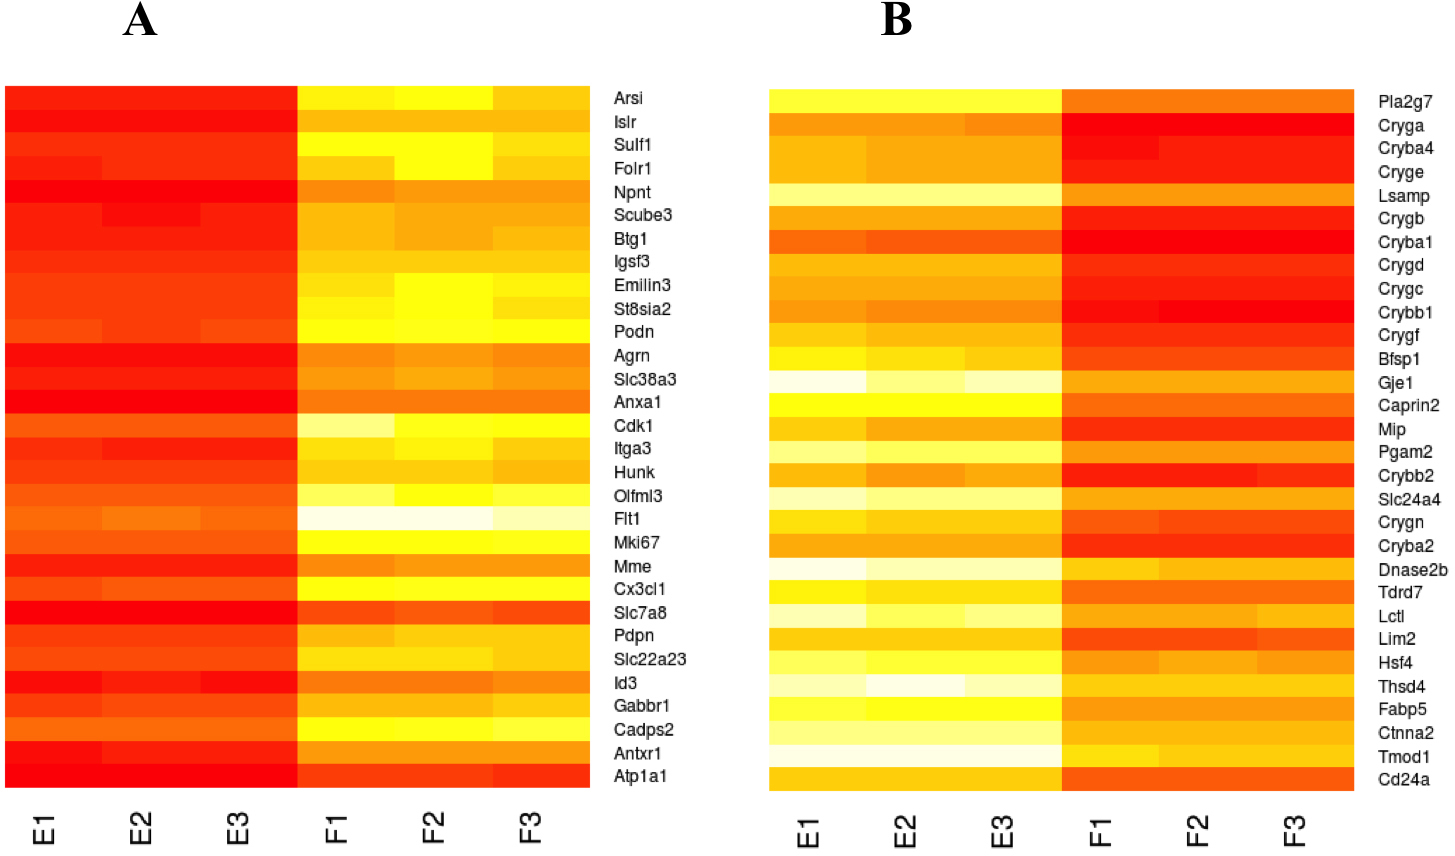
 Figure 2 of
Hoang, Mol Vis 2014; 20:1491-1517.
Figure 2 of
Hoang, Mol Vis 2014; 20:1491-1517.