Figure 1. Volcano plot showing differentially expressed genes between three replicates of lens epithelial cells and three replicates
of lens fiber cells. The x-axis corresponds to the log2 fold-change value, and the y-axis displays the log10 p value. The red dots represent the significantly differentially expressed transcripts (p≤0.05 and fold change ≥1.5) between
the lens epithelial cells and the lens fiber cells, while the black dots are not statistically significant (p>0.05).
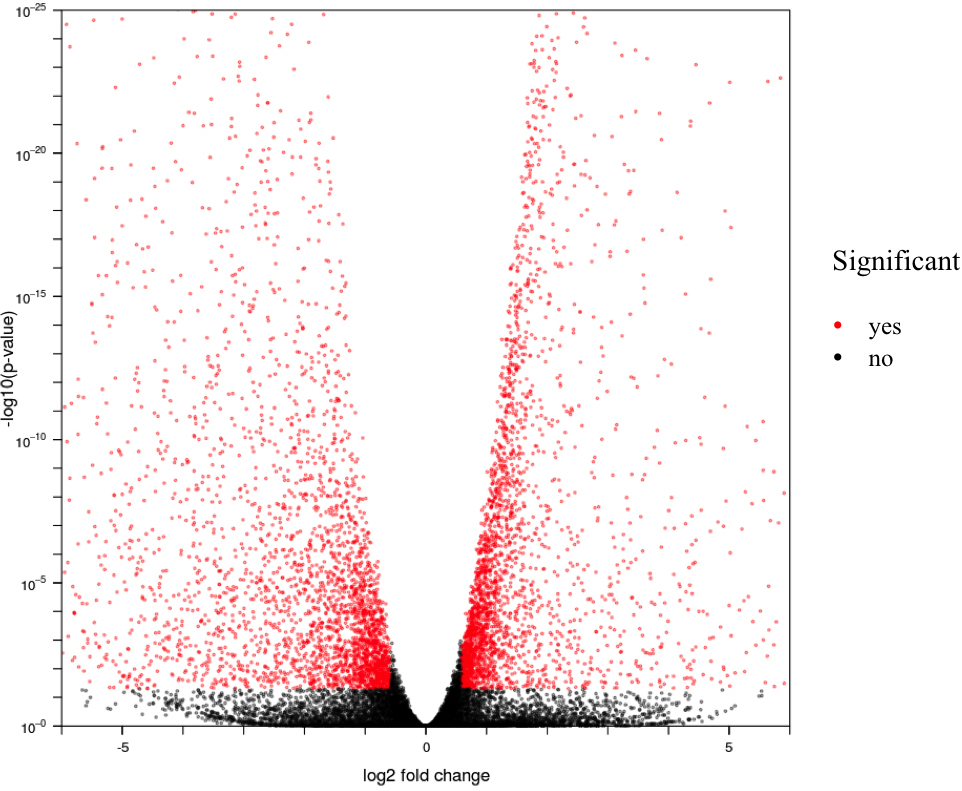
 Figure 1 of
Hoang, Mol Vis 2014; 20:1491-1517.
Figure 1 of
Hoang, Mol Vis 2014; 20:1491-1517.