Figure 5. Level of Mas receptor protein expression in the mouse retina at different developmental time points. A: Western blot detection of the Mas receptor protein expression in the developing mouse retina. β-actin was used as the loading
control. B: Quantification of the Mas receptor protein expression level normalized to β-actin. Sample size, n=4/age point, the bars
in this graph show the mean ± standard error of the mean (SEM). One-way ANOVA followed by Bonferroni’s multiple comparison
test was performed to analyze significance; * p<0.05 is considered statistically significant.
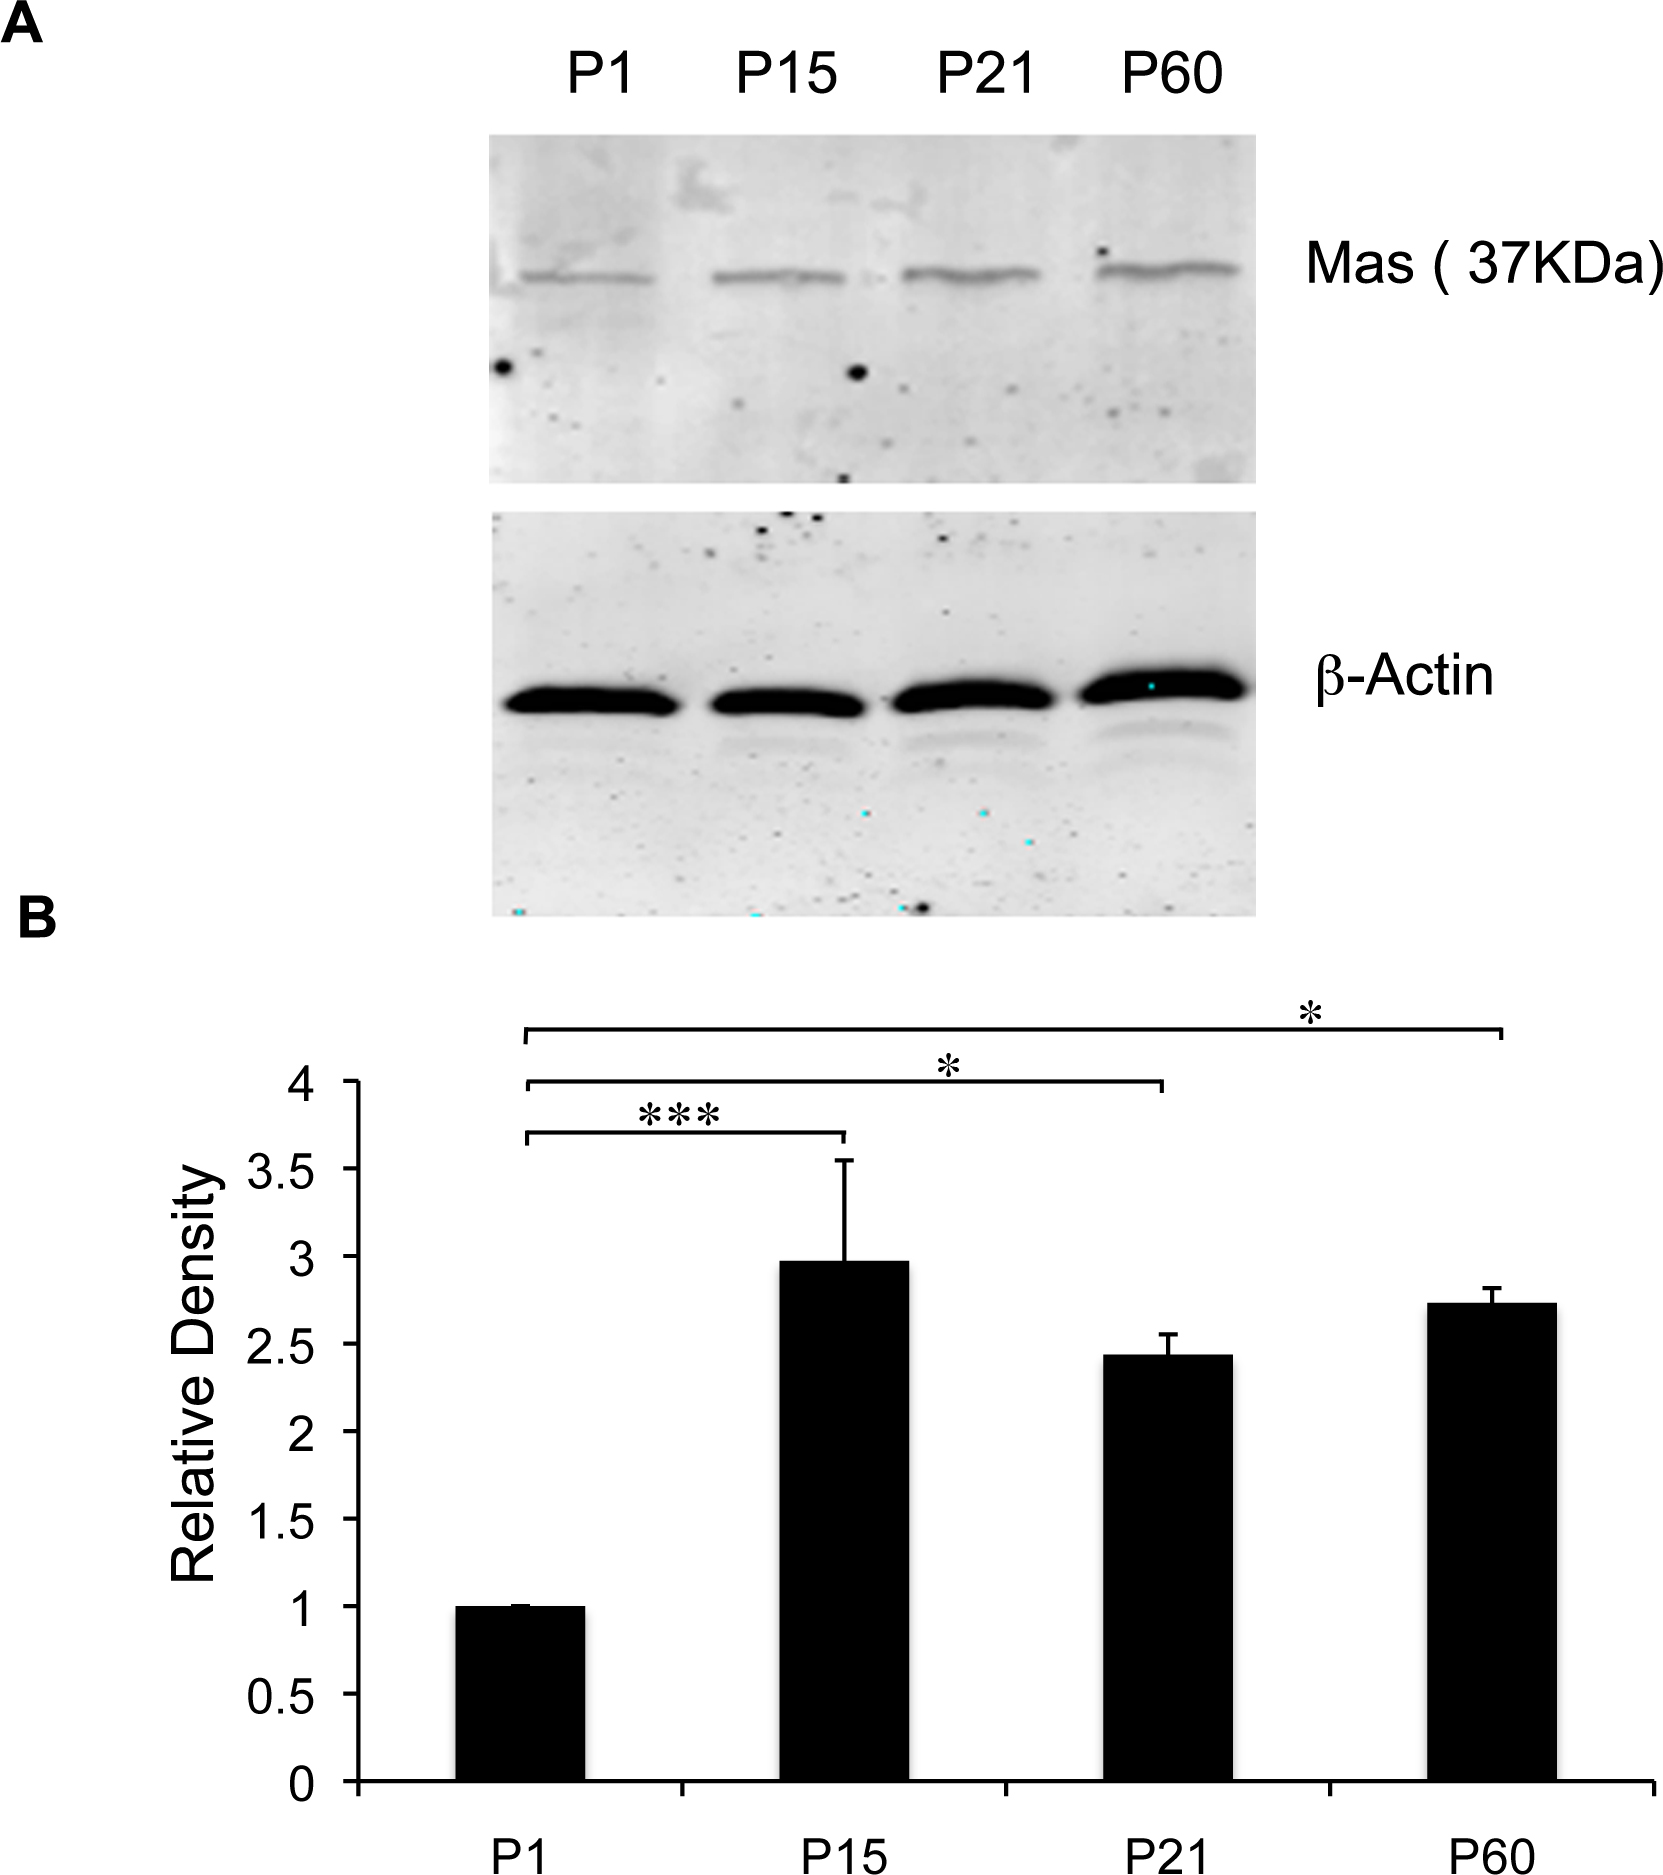
 Figure 5 of
Prasad, Mol Vis 2014; 20:1443-1455.
Figure 5 of
Prasad, Mol Vis 2014; 20:1443-1455.