Figure 1 of
Astafurov, Mol Vis 2014; 20:140-152.
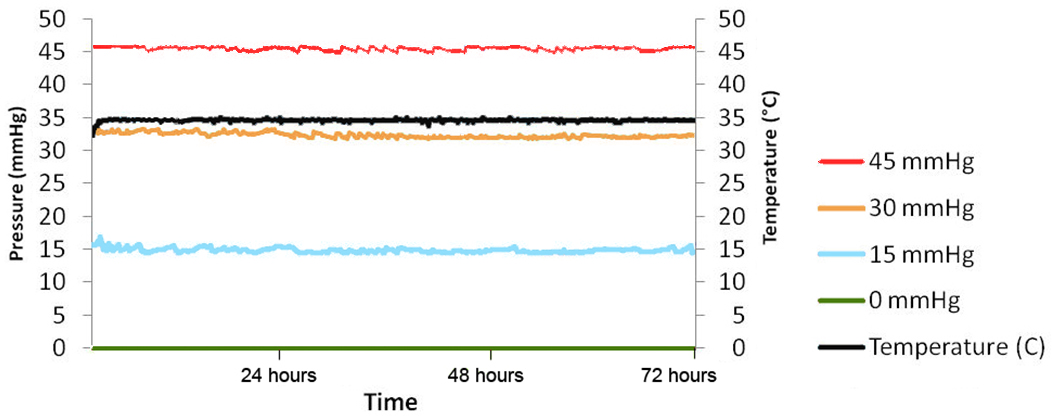
Figure 1.
Typical pressure and temperature graph of a 72-h pressurization experiment. The four chambers were maintained at 0, 15, 33, and 46 mmHg while temperature was 34.5 °C.
 Figure 1 of
Astafurov, Mol Vis 2014; 20:140-152.
Figure 1 of
Astafurov, Mol Vis 2014; 20:140-152.