Figure 2. Hepatitis C virus core and NS3 induced toll-like receptor activation. Human conjunctival fibroblasts were exposed to 20 ng/ml
of core and NS3 proteins for 6 h. Semiquantitative reverse transcription (RT)–PCR was performed to measure the TLR gene expression. A–C: Lanes 1, 18, and 34 represent the 100 bp DNA ladder; lane 2 represents PCR negative control; all the TLRs and GAPDH include
PCR products from the control, core, and NS3-treated groups in that order. Data are representative of three independent experiments.
D: During the core protein treatment, TLR7 and TLR10 were upregulated, and TLR5 was downregulated. During the NS3 protein treatment,
TLR1, TLR9, and TLR10 were upregulated; TLR2 was downregulated, and TLR8 expression was not detected. Data are represented
as mean ± standard error of the mean (SEM) over the untreated control group. *p<0.05.
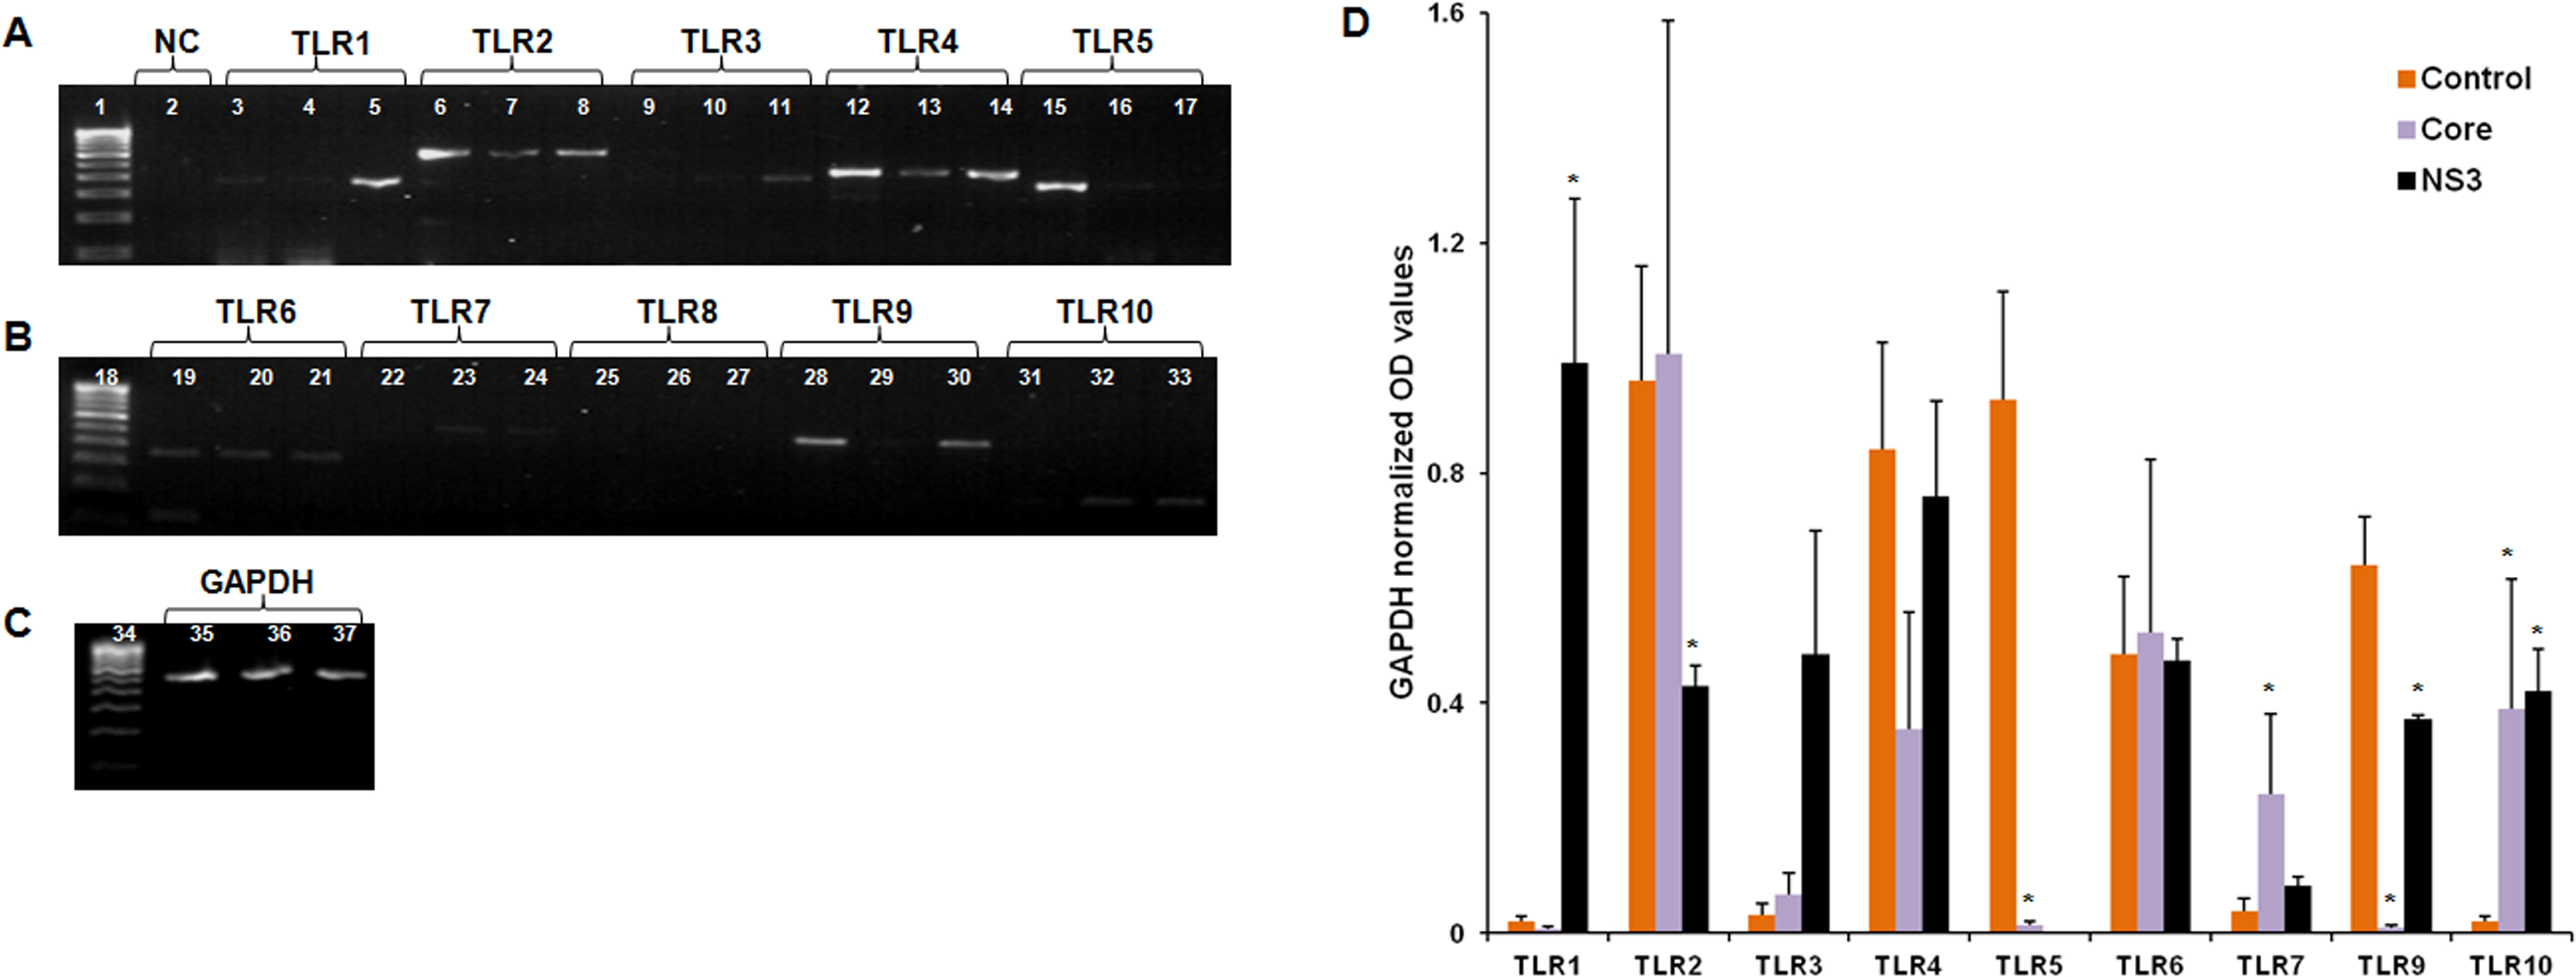
 Figure 2 of
Rajalakshmy, Mol Vis 2014; 20:1388-1397.
Figure 2 of
Rajalakshmy, Mol Vis 2014; 20:1388-1397.