Figure 8. Changes over time in RIP3 accumulation in the rat retina following ischemia. A: The amount of RIP3 protein was elevated at the 12 h post- ischemic time point in the animals from the experimental group
when compared with the 0 h and later post-ischemic time points. The western blot is representative of blots for each of the
three animals. After the increase at 12 h, the level of the RIP3 protein gradually returned to normal. B: The increase at the 12 h post-ischemic reperfusion time point in the animals from the experimental group was significant
compared to the 0 h and later time points. Data are presented as mean ± standard error of the mean (SEM). ***p<0.001. E=experimental
group; S=sham control group; ns=not significant.
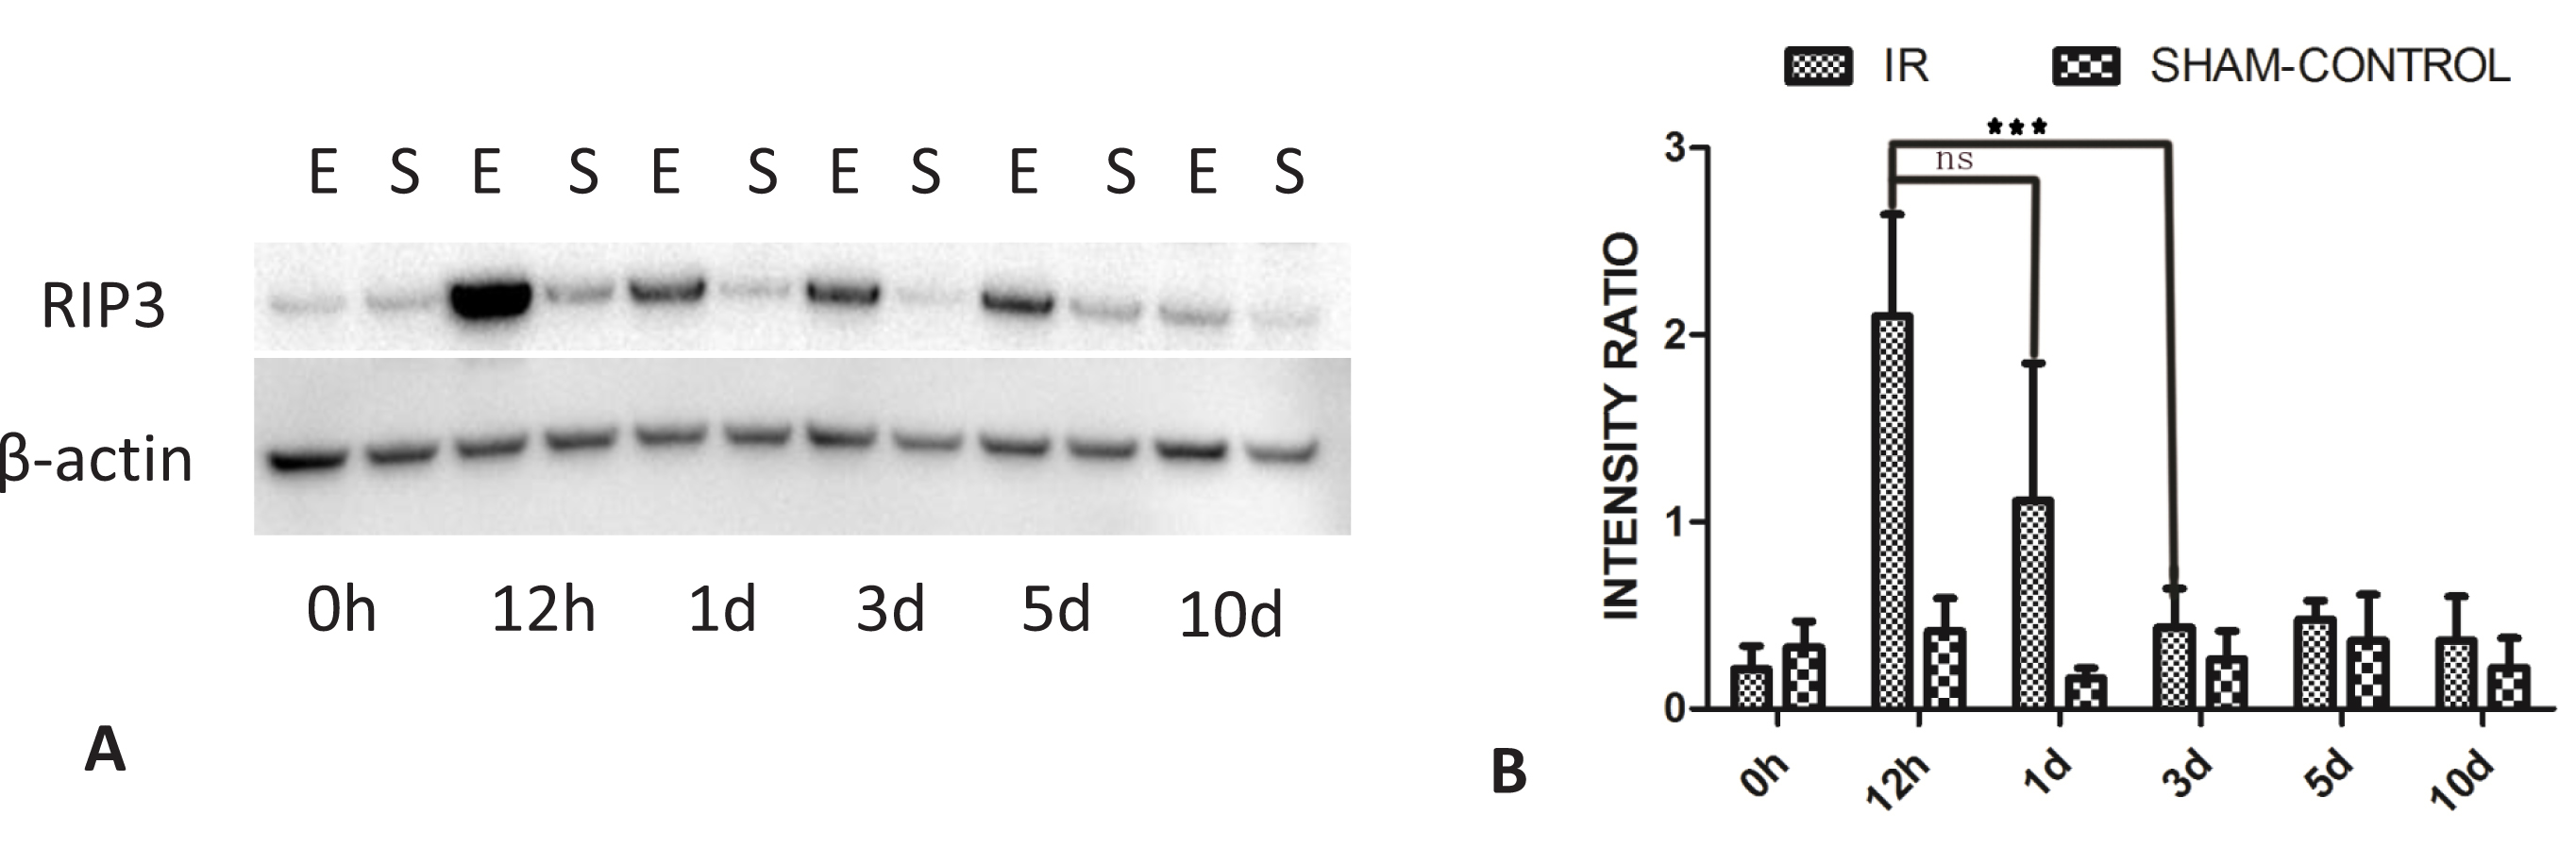
 Figure 8 of
Gao, Mol Vis 2014; 20:1374-1387.
Figure 8 of
Gao, Mol Vis 2014; 20:1374-1387.