Figure 1. Schematic representation of RAGE protein domains. The position of the glycosylation sites, disulfide bonds, and recognition
areas for the antibodies used in this experiment are shown. The monoclonal anti-RAGE antibody shown in pink recognizes the
extracellular domains of full-length RAGE. The polyclonal anti-RAGE antibody, shown in blue, recognizes the cytoplasmic tail
of full-length RAGE.
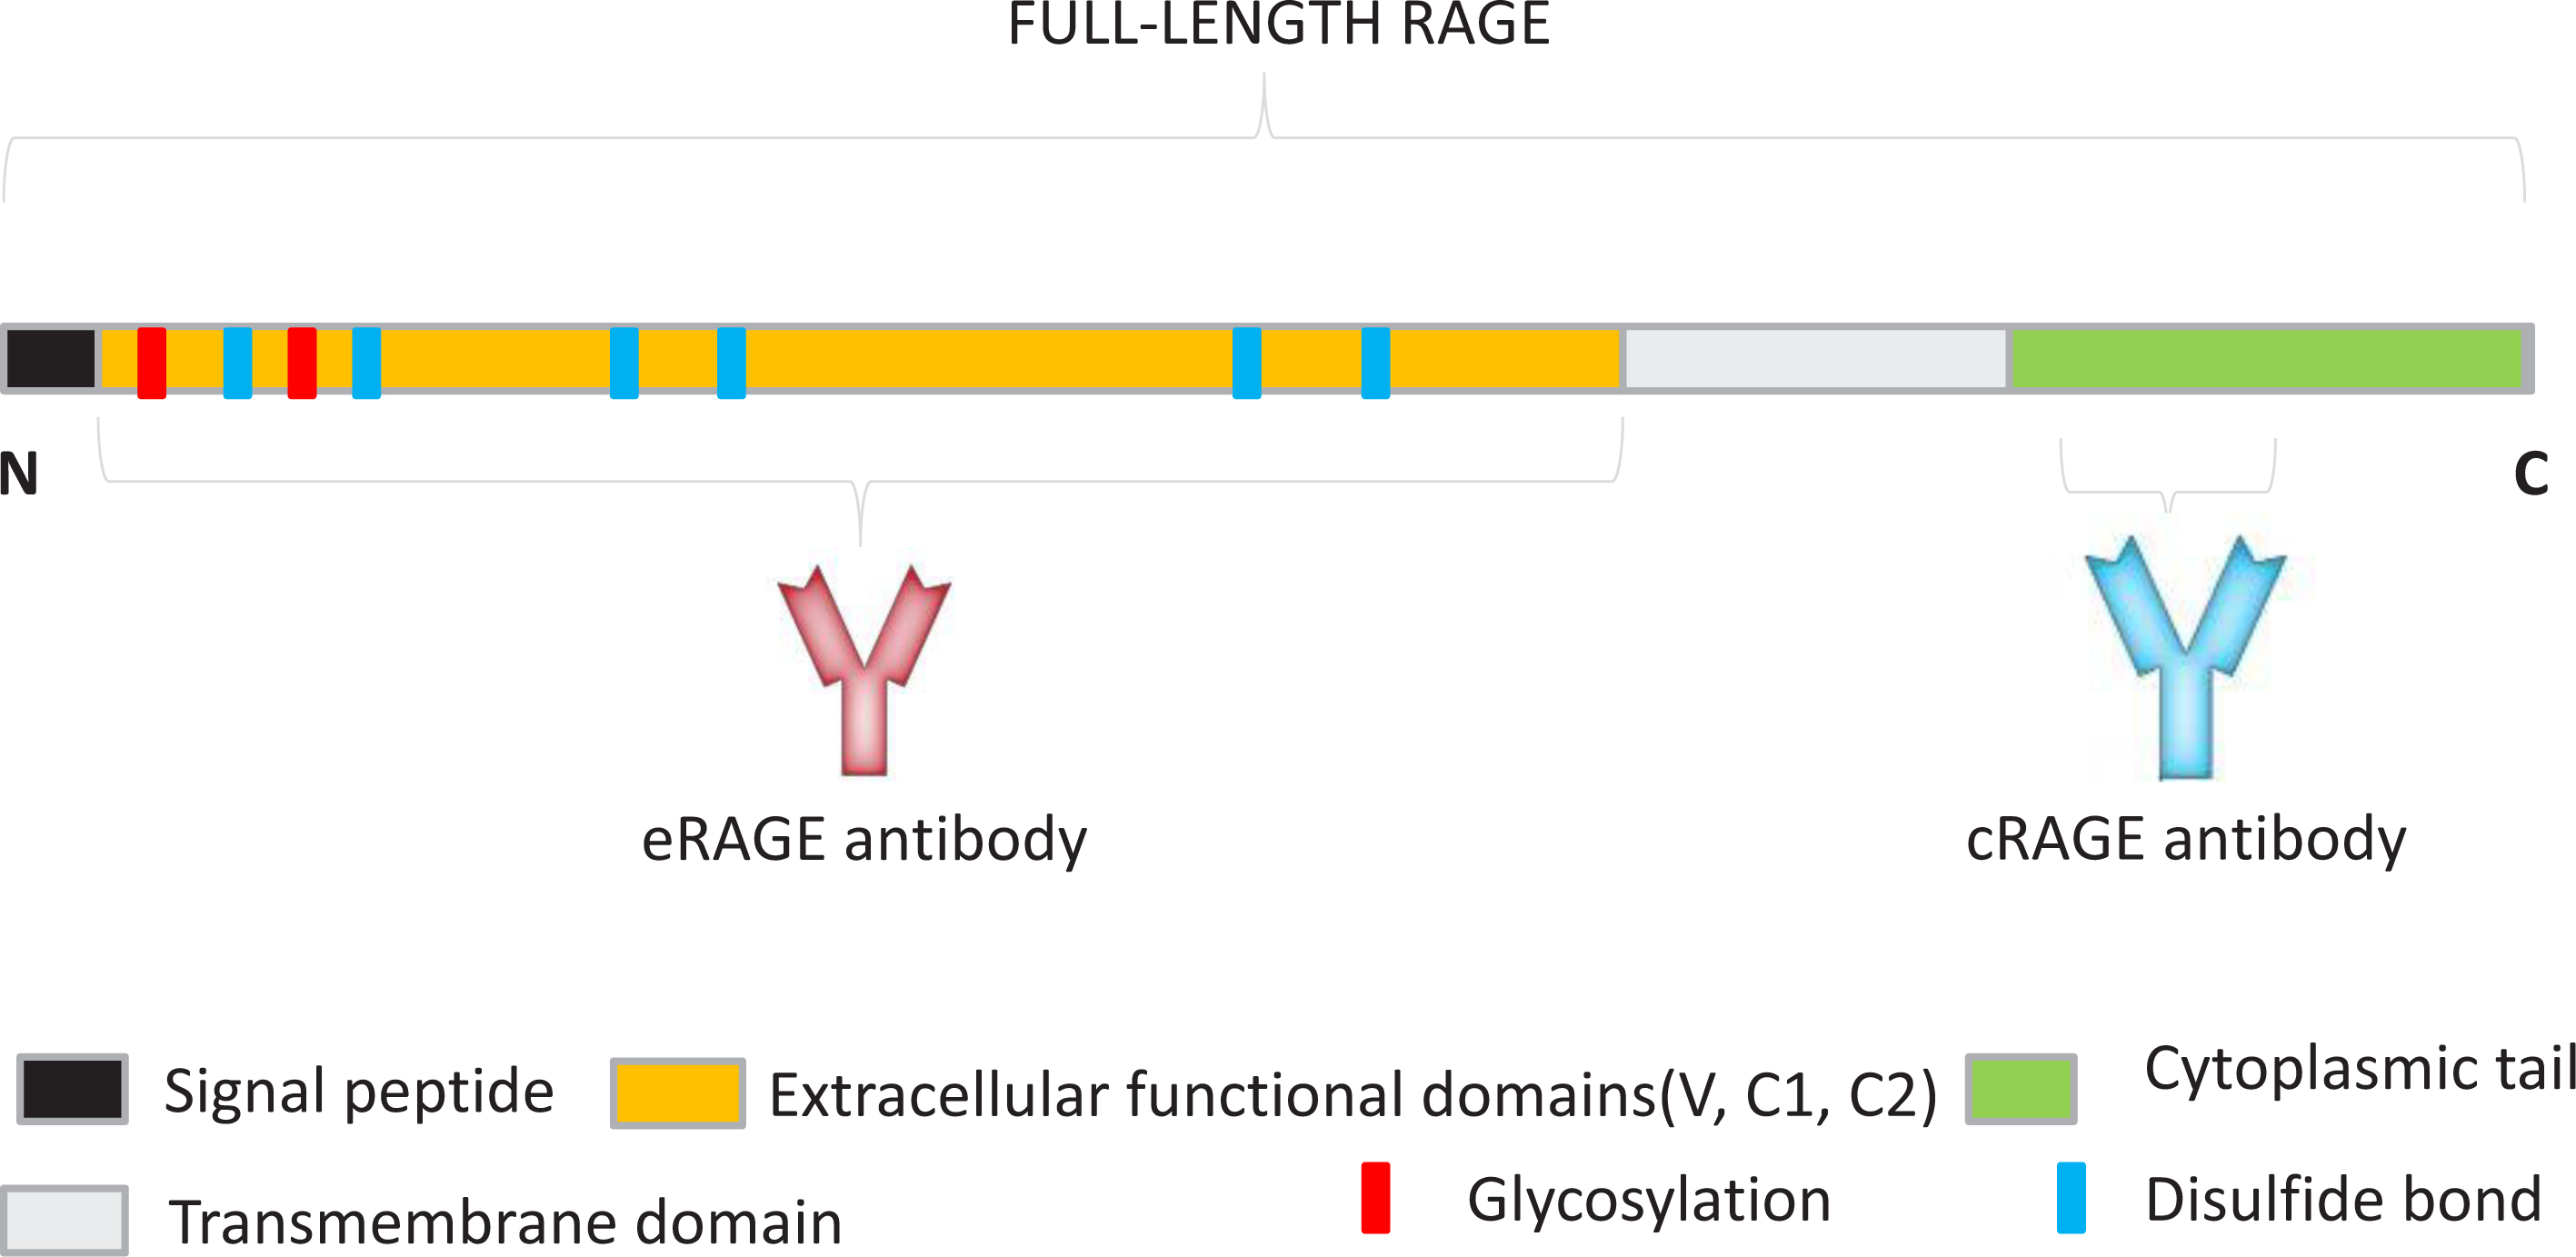
 Figure 1 of
Gao, Mol Vis 2014; 20:1374-1387.
Figure 1 of
Gao, Mol Vis 2014; 20:1374-1387.