Figure 5. A comparison of significant qPCR targets across experiments. The α2 nAChR subunits were upregulated in the whole retina and
downregulated in the GCL. The α5 nAChR subunits were downregulated in the whole retina using either superarray (SA) or designed
primers. The α9 nAChR subunits were upregulated in the whole retina and downregulated in the iINL. The α10 nAChR subunits
were upregulated in the whole retina. The β2 nAChR subunits were upregulated in the oINL. The β3 nAChR subunits were downregulated
in the iINL. The β4 nAChR subunits were upregulated in the whole retina and the oINL and downregulated in the iINL and the
GCL. The m1 mAChR subtypes were upregulated in the whole retina using designed primers and downregulated using SA primers.
The m2 mAChR subtypes were upregulated in the GCL and downregulated in the iINL. The m4 mAChR subtypes were upregulated in
the whole retina, the oINL, and the GCL and downregulated in the iINL. SA- SuperArray, WR- whole retina, oINL- outer portion
of INL, iINL- inner portion of INL, GCL- ganglion cell layer, Error bars represent SEM. ***p<0.001, SA (n=8), WR (n=11), LCM
(n=11).
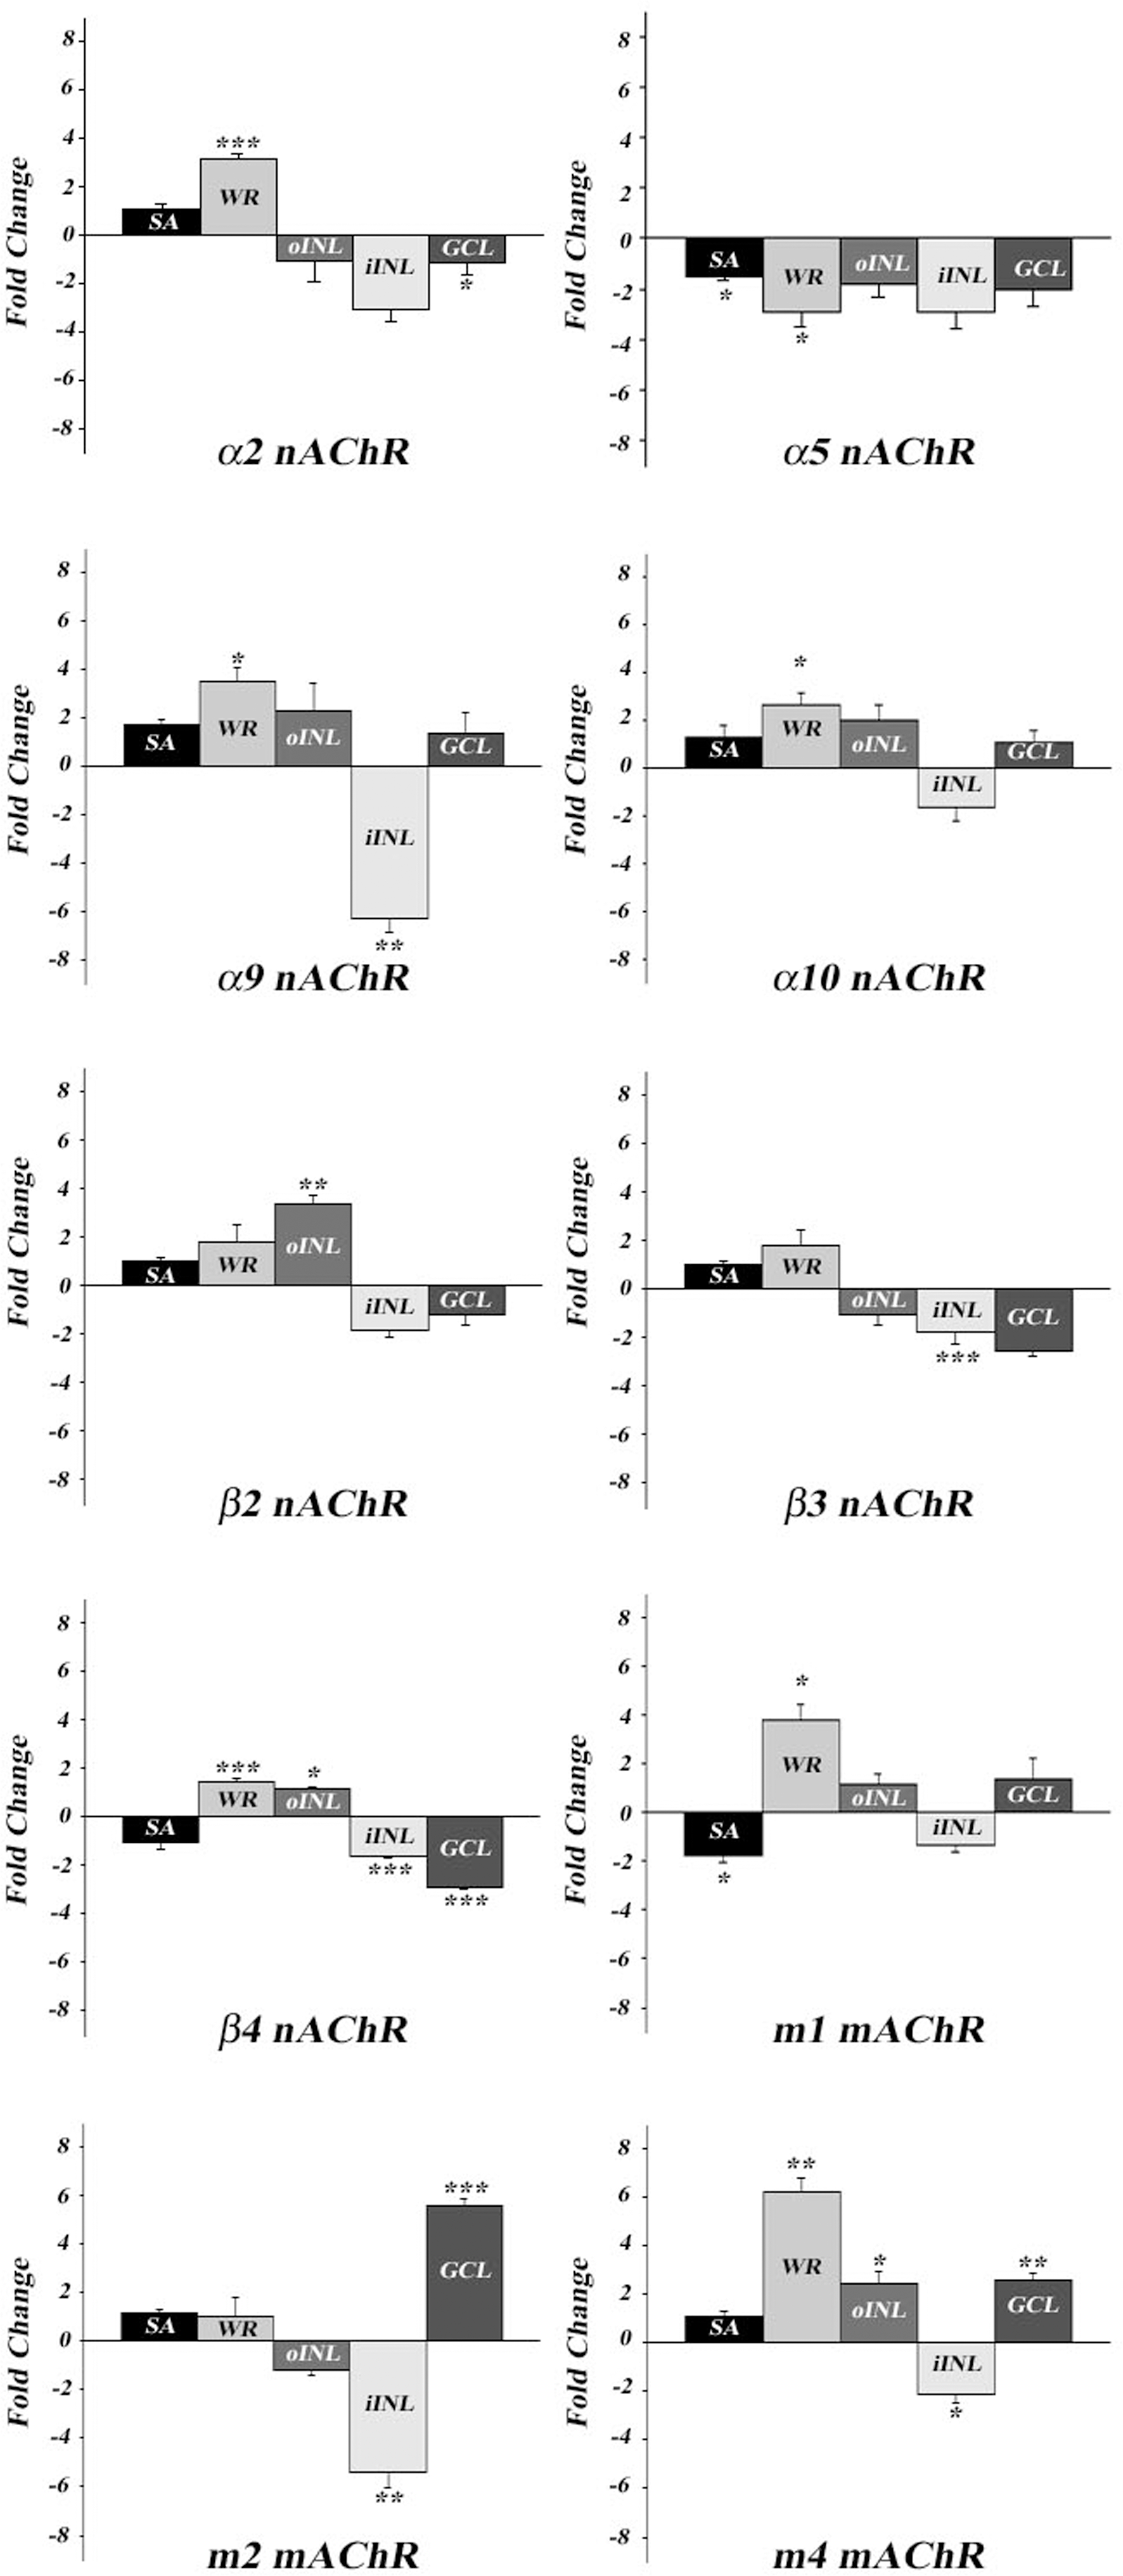
 Figure 5 of
Smith, Mol Vis 2014; 20:1328-1356.
Figure 5 of
Smith, Mol Vis 2014; 20:1328-1356.