Figure 3. Acetylcholine receptor qPCR fold changes in a whole mouse retina. The qPCR showed a significant upregulation of the α2, α9,
α10, and β4 nAChR subunits or the m1 and m4 mAChR subtypes. There was also a significant downregulation of the α5 nAChR subunit.
Error bars represent the SEM. *p<0.05, **p<0.01, ***p<0.001, (n=11).
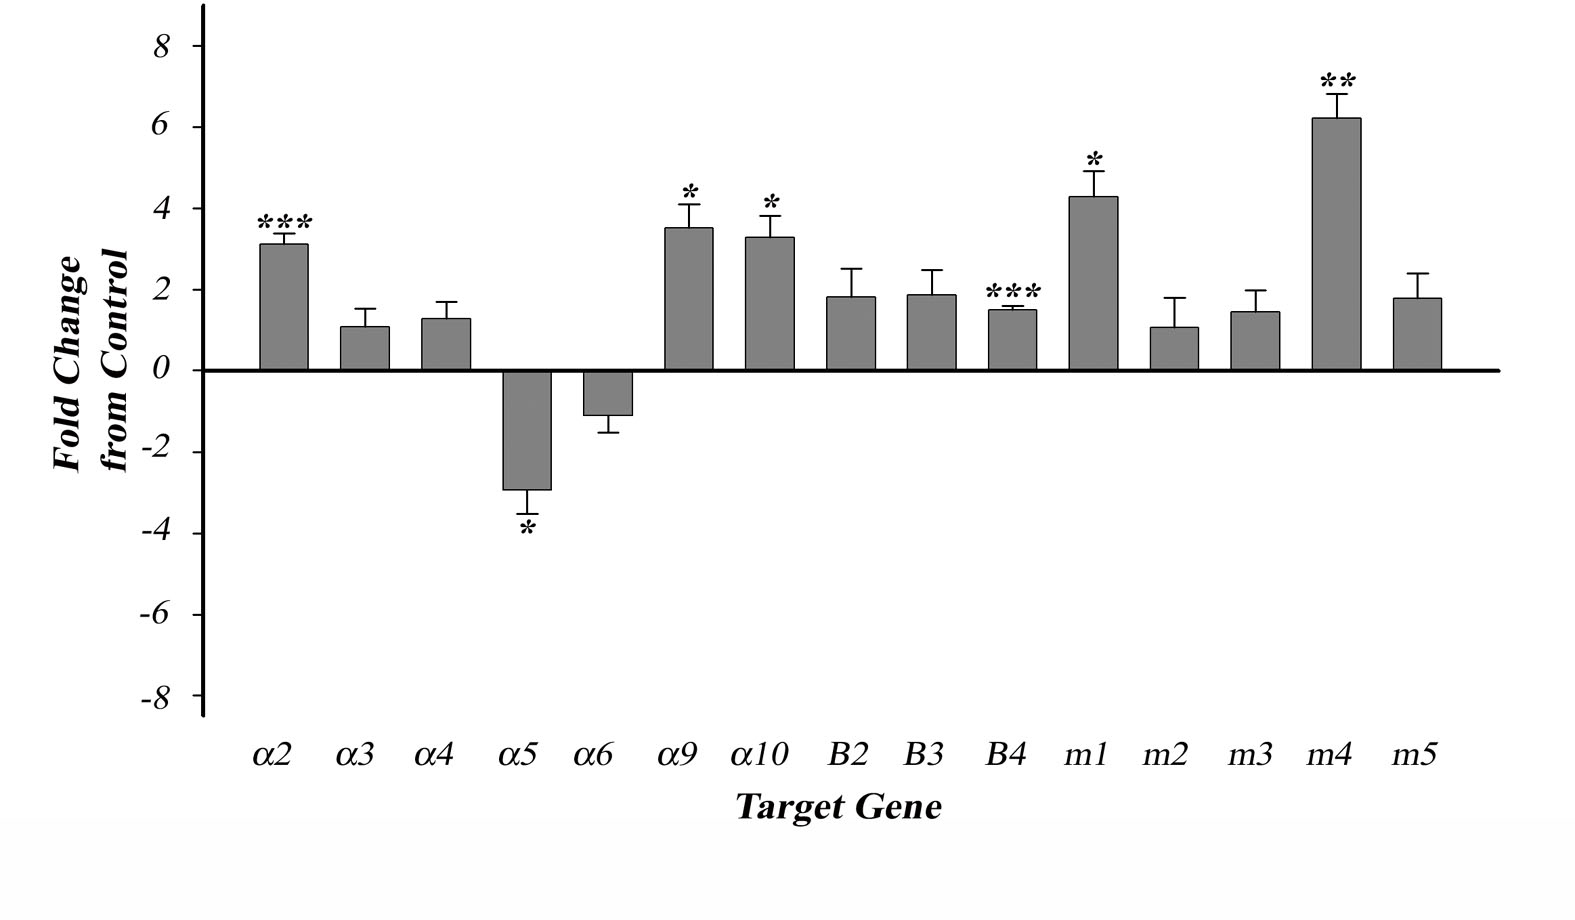
 Figure 3 of
Smith, Mol Vis 2014; 20:1328-1356.
Figure 3 of
Smith, Mol Vis 2014; 20:1328-1356.