Figure 2 of
Ritchie, Mol Vis 2014; 20:1281-1295.
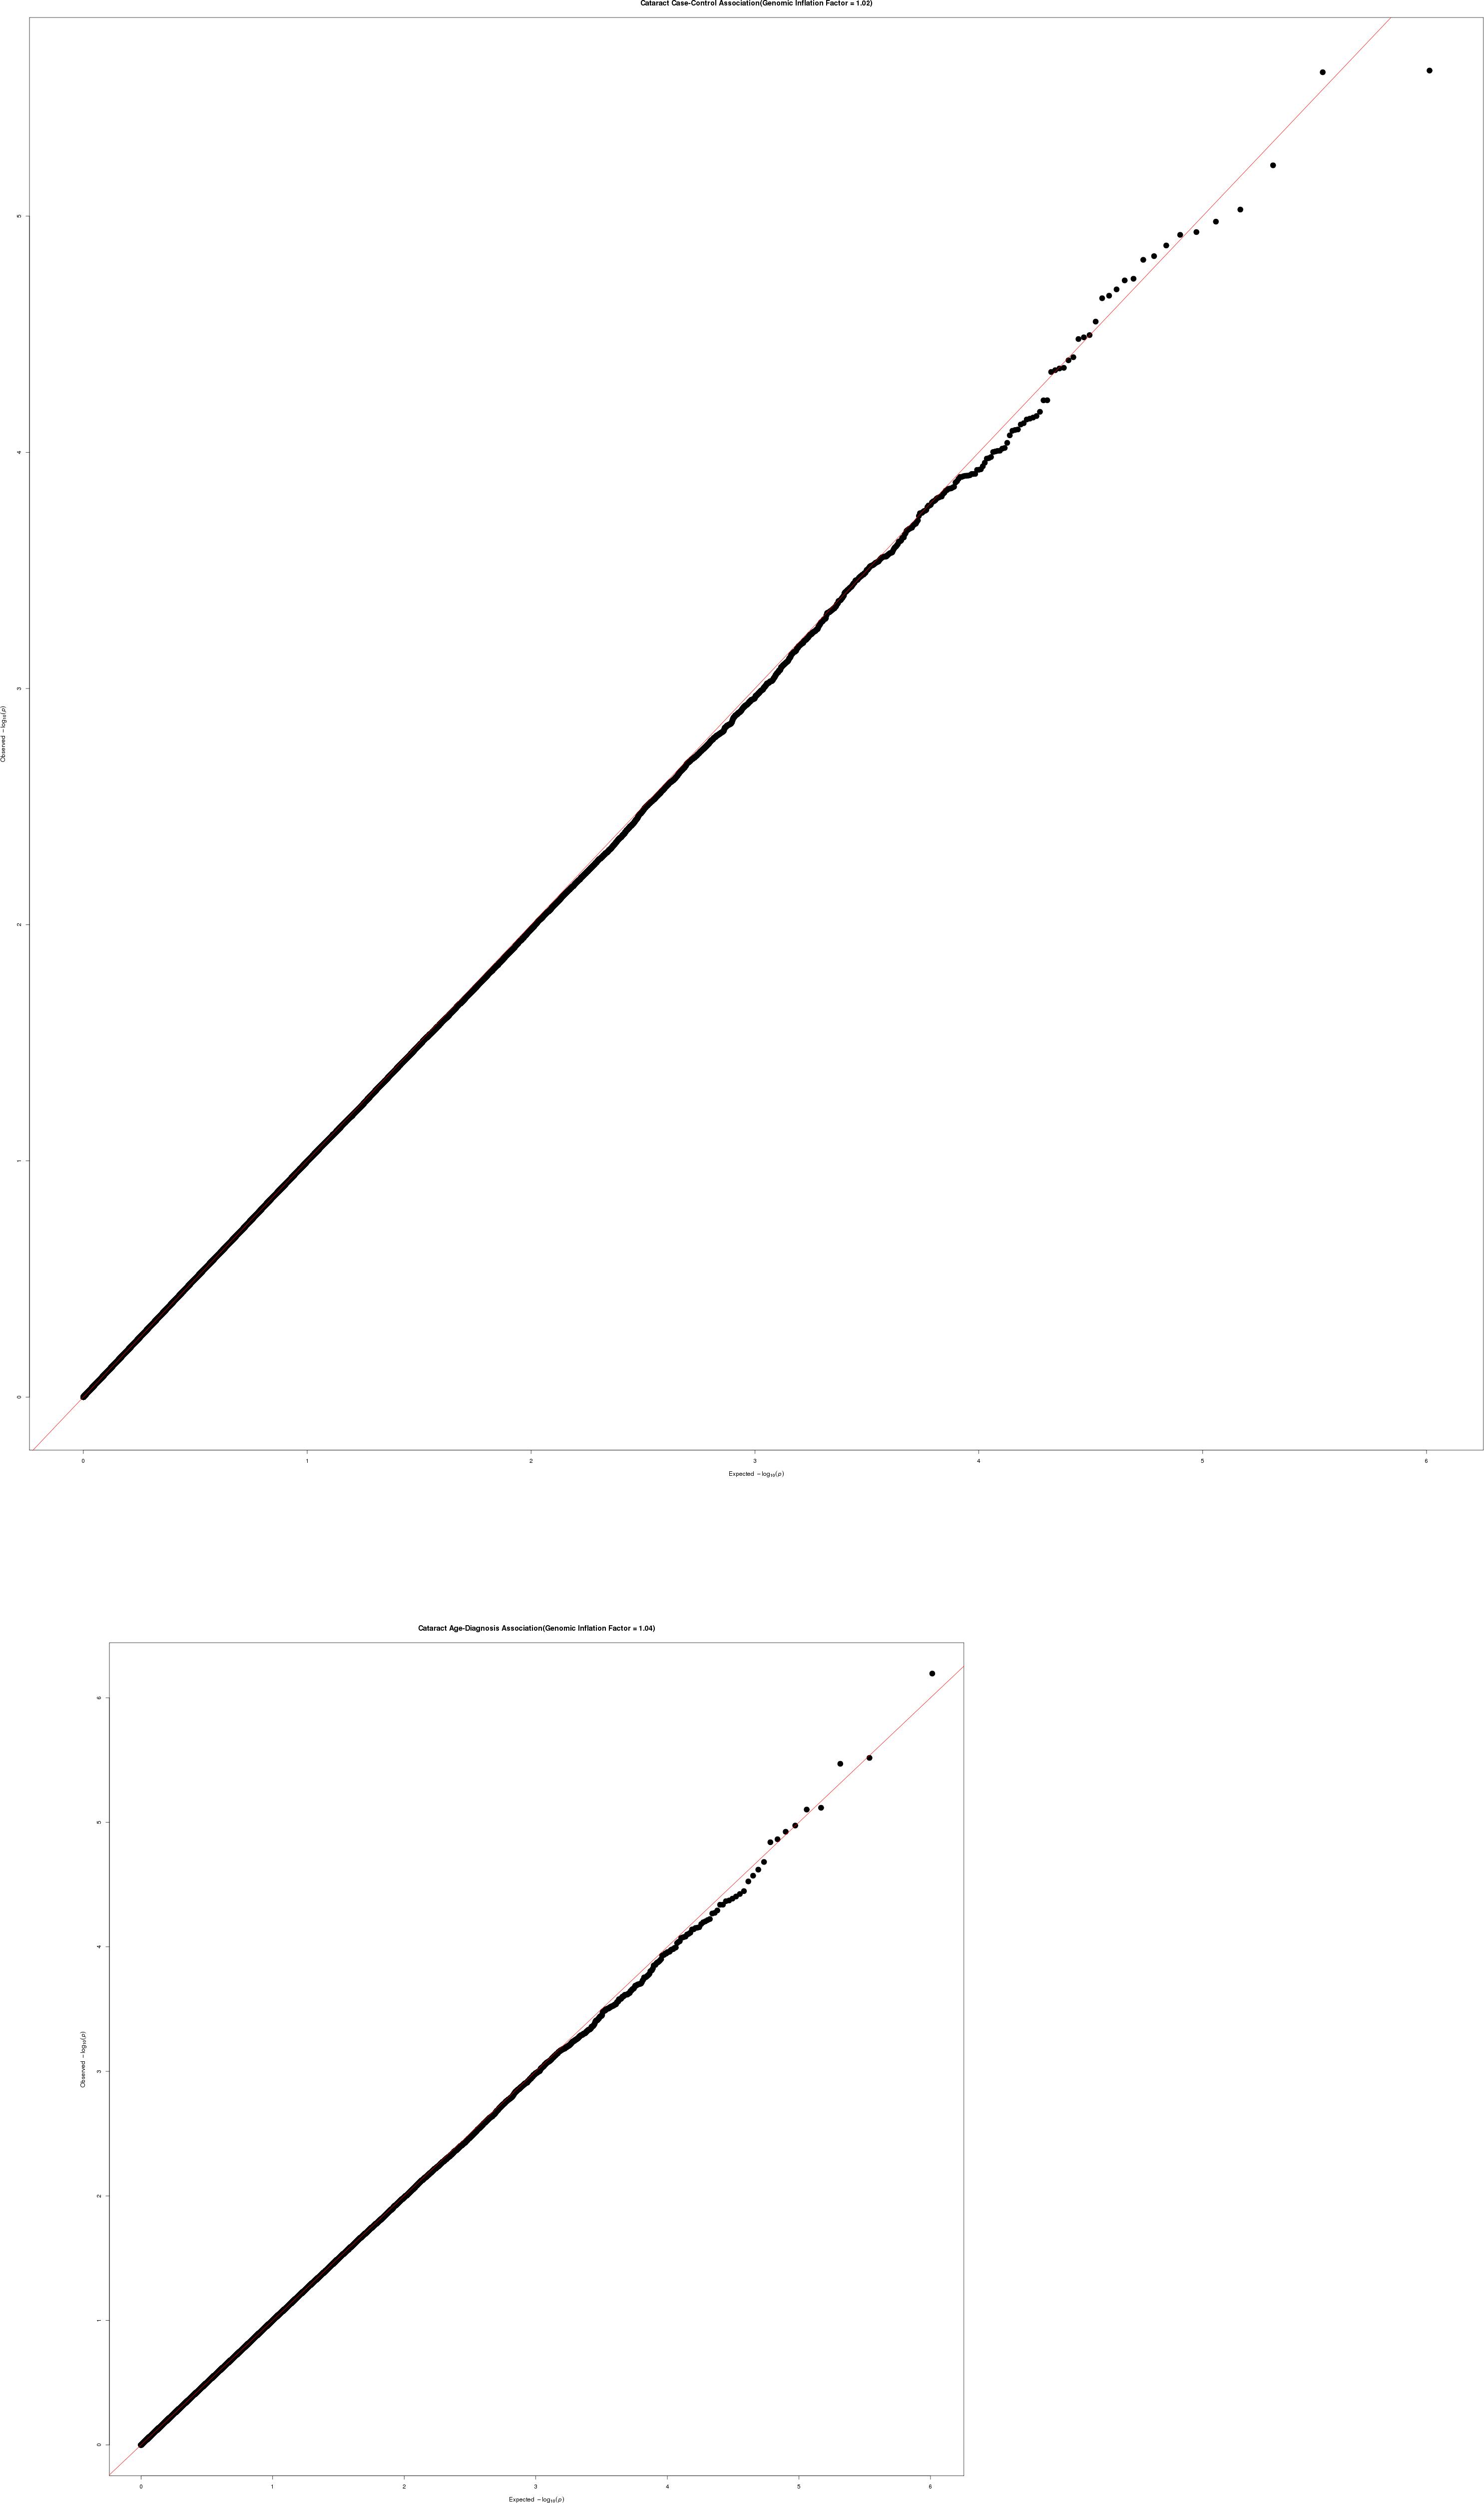
Figure 2.
Quantile-quantile plot for analysis adjusted by the first three principal components and site where eMERGE data were collected.
 Figure 2 of
Ritchie, Mol Vis 2014; 20:1281-1295. Figure 2 of
Ritchie, Mol Vis 2014; 20:1281-1295.
Figure 2 of
Ritchie, Mol Vis 2014; 20:1281-1295. Figure 2 of
Ritchie, Mol Vis 2014; 20:1281-1295.